## Scatter Plot: Accuracy vs. Number of Steps
### Overview
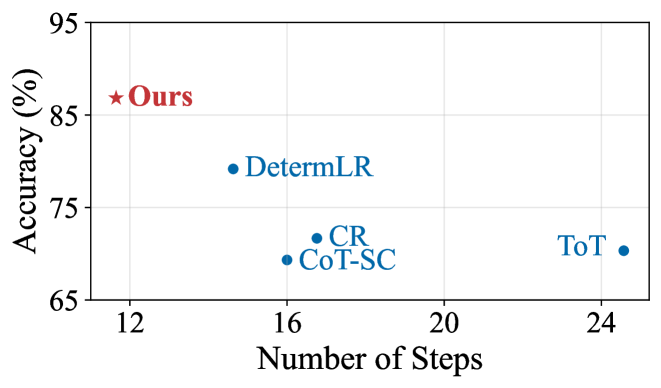
The image is a scatter plot comparing the accuracy (%) of different methods against the number of steps they require. The plot includes data points for "Ours", "DetermLR", "CR", "CoT-SC", and "ToT". The x-axis represents the number of steps, and the y-axis represents the accuracy in percentage.
### Components/Axes
* **X-axis:** "Number of Steps" with tick marks at 12, 16, 20, and 24.
* **Y-axis:** "Accuracy (%)" with tick marks at 65, 75, 85, and 95.
* **Data Series:**
* **Ours:** Represented by a red star.
* **DetermLR, CR, CoT-SC, ToT:** Represented by blue dots.
* **Gridlines:** Light gray gridlines are present in the background.
* **Legend:** The legend is implicitly defined by the labels next to each data point.
### Detailed Analysis
* **Ours:** The red star is located at approximately (12, 87).
* **DetermLR:** The blue dot is located at approximately (16, 79).
* **CR:** The blue dot is located at approximately (17, 72).
* **CoT-SC:** The blue dot is located at approximately (17, 70).
* **ToT:** The blue dot is located at approximately (24, 70).
### Key Observations
* "Ours" achieves the highest accuracy with the fewest number of steps.
* "ToT" requires the most steps but has a lower accuracy than "Ours" and "DetermLR".
* "CR" and "CoT-SC" have similar performance in terms of accuracy and number of steps.
### Interpretation
The scatter plot suggests that the "Ours" method is superior to the other methods in terms of accuracy and efficiency (number of steps). The other methods, "DetermLR", "CR", "CoT-SC", and "ToT", have lower accuracy and/or require more steps to achieve their respective accuracy levels. The plot highlights a trade-off between accuracy and the number of steps required, with "Ours" seemingly optimizing both.