## Scatter Plot: Accuracy vs. Number of Steps
### Overview
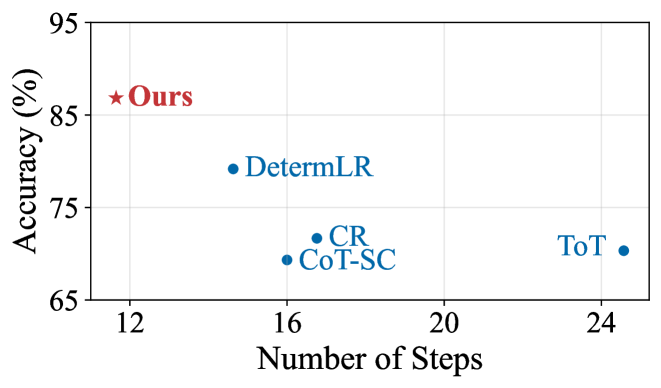
The image is a scatter plot comparing the accuracy (in percentage) of different methods against the number of steps required. The plot includes five data points labeled with method names, each represented by distinct colors and markers. The x-axis represents the "Number of Steps," and the y-axis represents "Accuracy (%)." A legend identifies the color coding for the methods.
---
### Components/Axes
- **X-axis (Number of Steps)**: Labeled with approximate values at 12, 16, 20, and 24. The axis spans from 12 to 24.
- **Y-axis (Accuracy %)**: Labeled with approximate values at 65, 75, 85, and 95. The axis spans from 65 to 95.
- **Legend**: Located in the top-right corner (inferred from standard chart conventions). It associates:
- **Red star**: "Ours"
- **Blue dots**: "DetermLR," "CR," "CoT-SC," and "ToT"
---
### Detailed Analysis
- **Data Points**:
- **"Ours"**: Red star at (12, 85). This is the highest accuracy point, positioned at 12 steps.
- **"DetermLR"**: Blue dot at (16, 77). Located at 16 steps with 77% accuracy.
- **"CR"**: Blue dot at (16, 72). Same x-axis value as "DetermLR" but lower accuracy.
- **"CoT-SC"**: Blue dot at (16, 68). Also at 16 steps but with the lowest accuracy among the blue points.
- **"ToT"**: Blue dot at (24, 70). Positioned at 24 steps with 70% accuracy.
- **Trends**:
- The red star ("Ours") is the only data point above 80% accuracy, indicating superior performance.
- The blue points cluster around 16 steps, with "DetermLR" being the highest among them.
- "ToT" is the only blue point at 24 steps, but its accuracy (70%) is lower than "Ours" (85%).
---
### Key Observations
1. **"Ours" outperforms all other methods** in accuracy, achieving 85% at 12 steps.
2. **Blue methods** (DetermLR, CR, CoT-SC, ToT) show lower accuracy, with "DetermLR" being the most efficient among them (77% at 16 steps).
3. **"ToT" requires the most steps (24)** but still lags behind "Ours" in accuracy.
---
### Interpretation
The data suggests that the method labeled "Ours" is significantly more efficient, achieving higher accuracy with fewer steps compared to other methods. The blue methods (DetermLR, CR, CoT-SC, ToT) exhibit a trade-off between steps and accuracy, with "DetermLR" being the most balanced. The clustering of blue points around 16 steps implies that these methods may have similar computational demands but varying effectiveness. "ToT" stands out as the least efficient, requiring the most steps for a relatively low accuracy gain. This plot highlights the importance of optimizing step count while maintaining high accuracy, with "Ours" demonstrating the optimal balance.