## Graph Diagram: Network of Nodes
### Overview
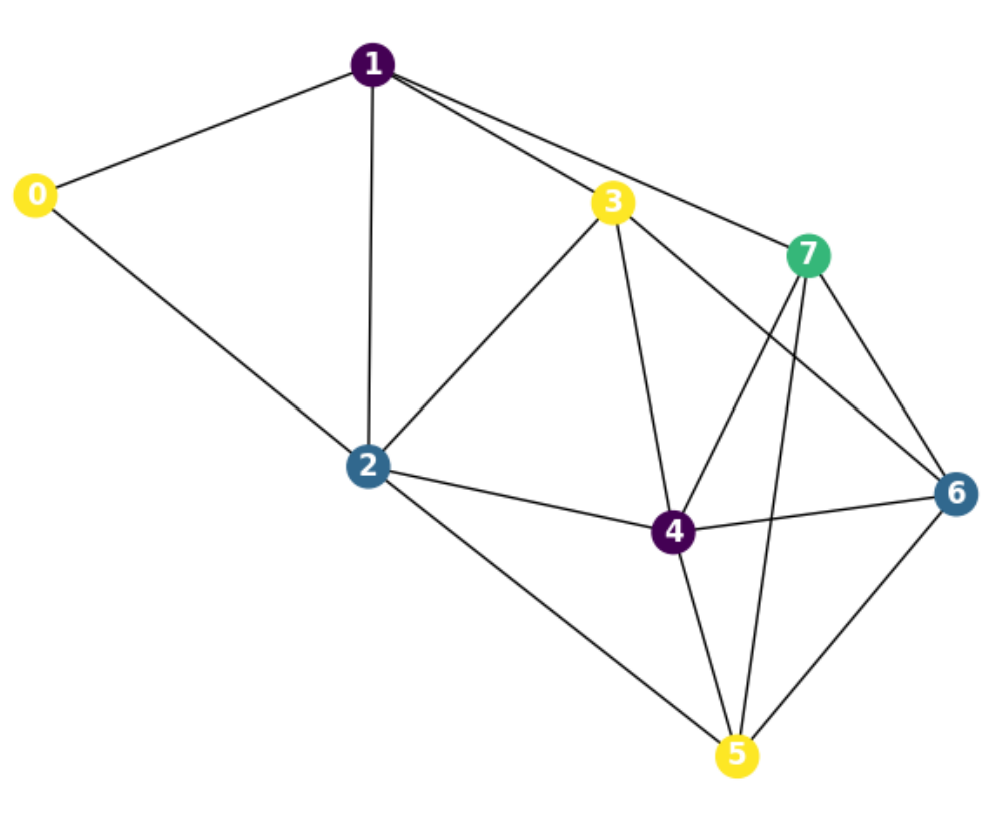
The image depicts a graph diagram consisting of 8 nodes (labeled 0 through 7) connected by edges. The nodes are colored differently, and the edges represent relationships or connections between them.
### Components/Axes
* **Nodes:** 8 nodes, labeled 0, 1, 2, 3, 4, 5, 6, and 7. Each node is represented by a colored circle with a number inside.
* Node 0: Yellow
* Node 1: Purple
* Node 2: Dark Blue
* Node 3: Yellow
* Node 4: Purple
* Node 5: Yellow
* Node 6: Dark Blue
* Node 7: Green
* **Edges:** Black lines connecting the nodes, indicating relationships between them.
### Detailed Analysis
The graph shows the following connections:
* Node 0 (Yellow) is connected to Node 1 (Purple) and Node 2 (Dark Blue).
* Node 1 (Purple) is connected to Node 0 (Yellow), Node 2 (Dark Blue), and Node 3 (Yellow).
* Node 2 (Dark Blue) is connected to Node 0 (Yellow), Node 1 (Purple), Node 3 (Yellow), Node 4 (Purple), and Node 5 (Yellow).
* Node 3 (Yellow) is connected to Node 1 (Purple), Node 2 (Dark Blue), Node 4 (Purple), and Node 7 (Green).
* Node 4 (Purple) is connected to Node 2 (Dark Blue), Node 3 (Yellow), Node 5 (Yellow), Node 6 (Dark Blue), and Node 7 (Green).
* Node 5 (Yellow) is connected to Node 2 (Dark Blue), Node 4 (Purple), and Node 6 (Dark Blue).
* Node 6 (Dark Blue) is connected to Node 4 (Purple), Node 5 (Yellow), and Node 7 (Green).
* Node 7 (Green) is connected to Node 3 (Yellow), Node 4 (Purple), and Node 6 (Dark Blue).
### Key Observations
* Node 2 (Dark Blue) has the most connections (5 edges).
* Node 0 (Yellow) has the fewest connections (2 edges).
* The graph appears to be undirected, meaning the edges do not have a specific direction.
* Nodes 3, 4, 6, and 7 form a highly interconnected cluster.
### Interpretation
The graph diagram represents a network where nodes are interconnected based on certain relationships. The different colors assigned to the nodes could represent different categories or attributes. The connections between nodes indicate interactions or dependencies. The density of connections varies across the graph, with some nodes being more central or influential than others. The diagram could be used to visualize social networks, communication networks, or any system where entities are related to each other.