## Network Diagram: Node Connections and Color-Coded Relationships
### Overview
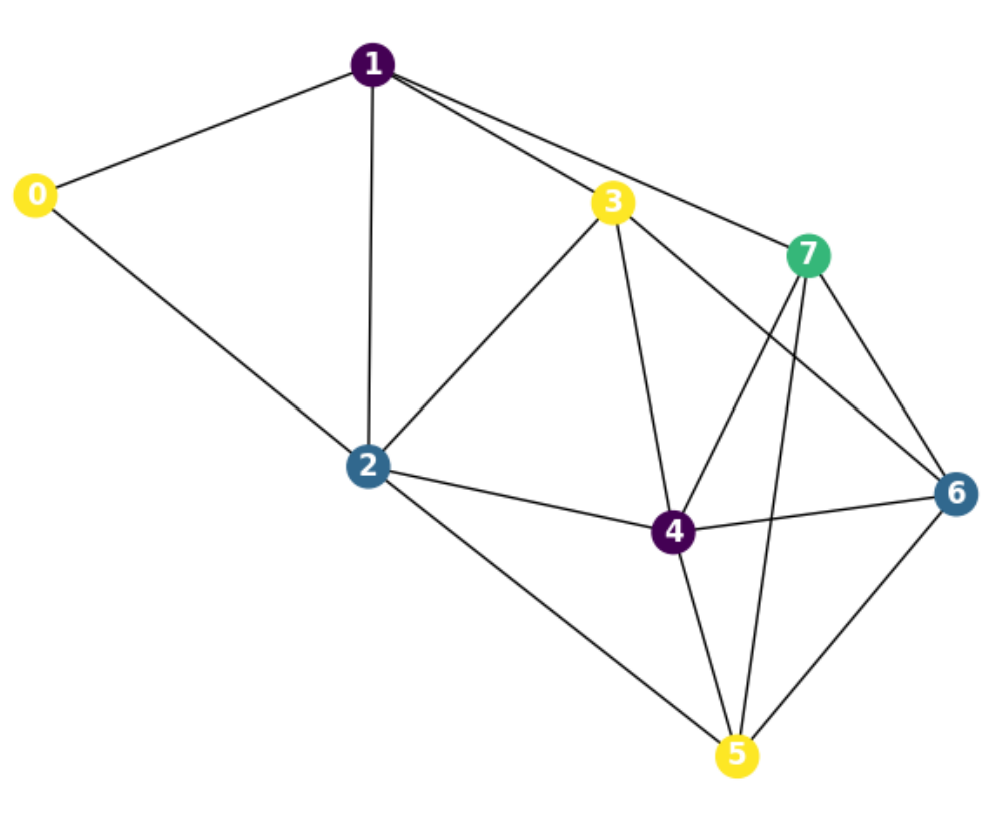
The image depicts a network diagram with 8 nodes labeled 0–7, connected by black edges. Nodes are color-coded (yellow, purple, blue, green) and arranged in a non-linear, interconnected pattern. The diagram emphasizes relationships between nodes, with no explicit numerical data or axes.
### Components/Axes
- **Nodes**:
- **0**: Yellow circle (top-left)
- **1**: Purple circle (top-center)
- **2**: Blue circle (middle-left)
- **3**: Yellow circle (middle-center)
- **4**: Purple circle (middle-right)
- **5**: Yellow circle (bottom-center)
- **6**: Blue circle (bottom-right)
- **7**: Green circle (top-right)
- **Legend**:
- Located on the right side of the diagram.
- Colors correspond to node labels:
- Yellow: 0, 3, 5
- Purple: 1, 4
- Blue: 2, 6
- Green: 7
- **Edges**:
- Black lines connect nodes, forming a complex web.
- No explicit labels or weights on edges.
### Detailed Analysis
- **Node Connections**:
- **Node 1** (purple) connects to 0, 2, 3, and 4.
- **Node 3** (yellow) connects to 1, 2, 4, 5, 6, and 7.
- **Node 7** (green) connects only to 3 and 6.
- **Node 5** (yellow) connects to 3, 4, and 6.
- **Node 6** (blue) connects to 3, 4, 5, and 7.
- **Color Consistency**:
- All nodes match the legend (e.g., node 3 is yellow, node 7 is green).
- No discrepancies between node colors and legend labels.
### Key Observations
1. **Central Hub**: Node 3 (yellow) is the most connected, acting as a central hub with 6 edges.
2. **Peripheral Nodes**: Nodes 0, 2, and 7 have fewer connections (2–3 edges each).
3. **Color Distribution**:
- Yellow nodes (0, 3, 5) are spread across the diagram.
- Purple nodes (1, 4) are centrally located.
- Blue nodes (2, 6) are on the periphery.
- Green node (7) is isolated to the top-right.
### Interpretation
The diagram illustrates a network where **node 3** serves as a critical junction, connecting multiple nodes (1, 2, 4, 5, 6, 7). This suggests it may represent a key resource, hub, or central entity in a system. The color coding could indicate categories (e.g., roles, types, or priorities), with yellow nodes potentially representing a distinct group. The lack of numerical data or explicit labels on edges implies the focus is on structural relationships rather than quantitative metrics. The diagram’s complexity highlights potential dependencies or interactions within the network, with node 3’s centrality underscoring its importance.