\n
## Line Chart: Pass@k vs. k for Different Models
### Overview
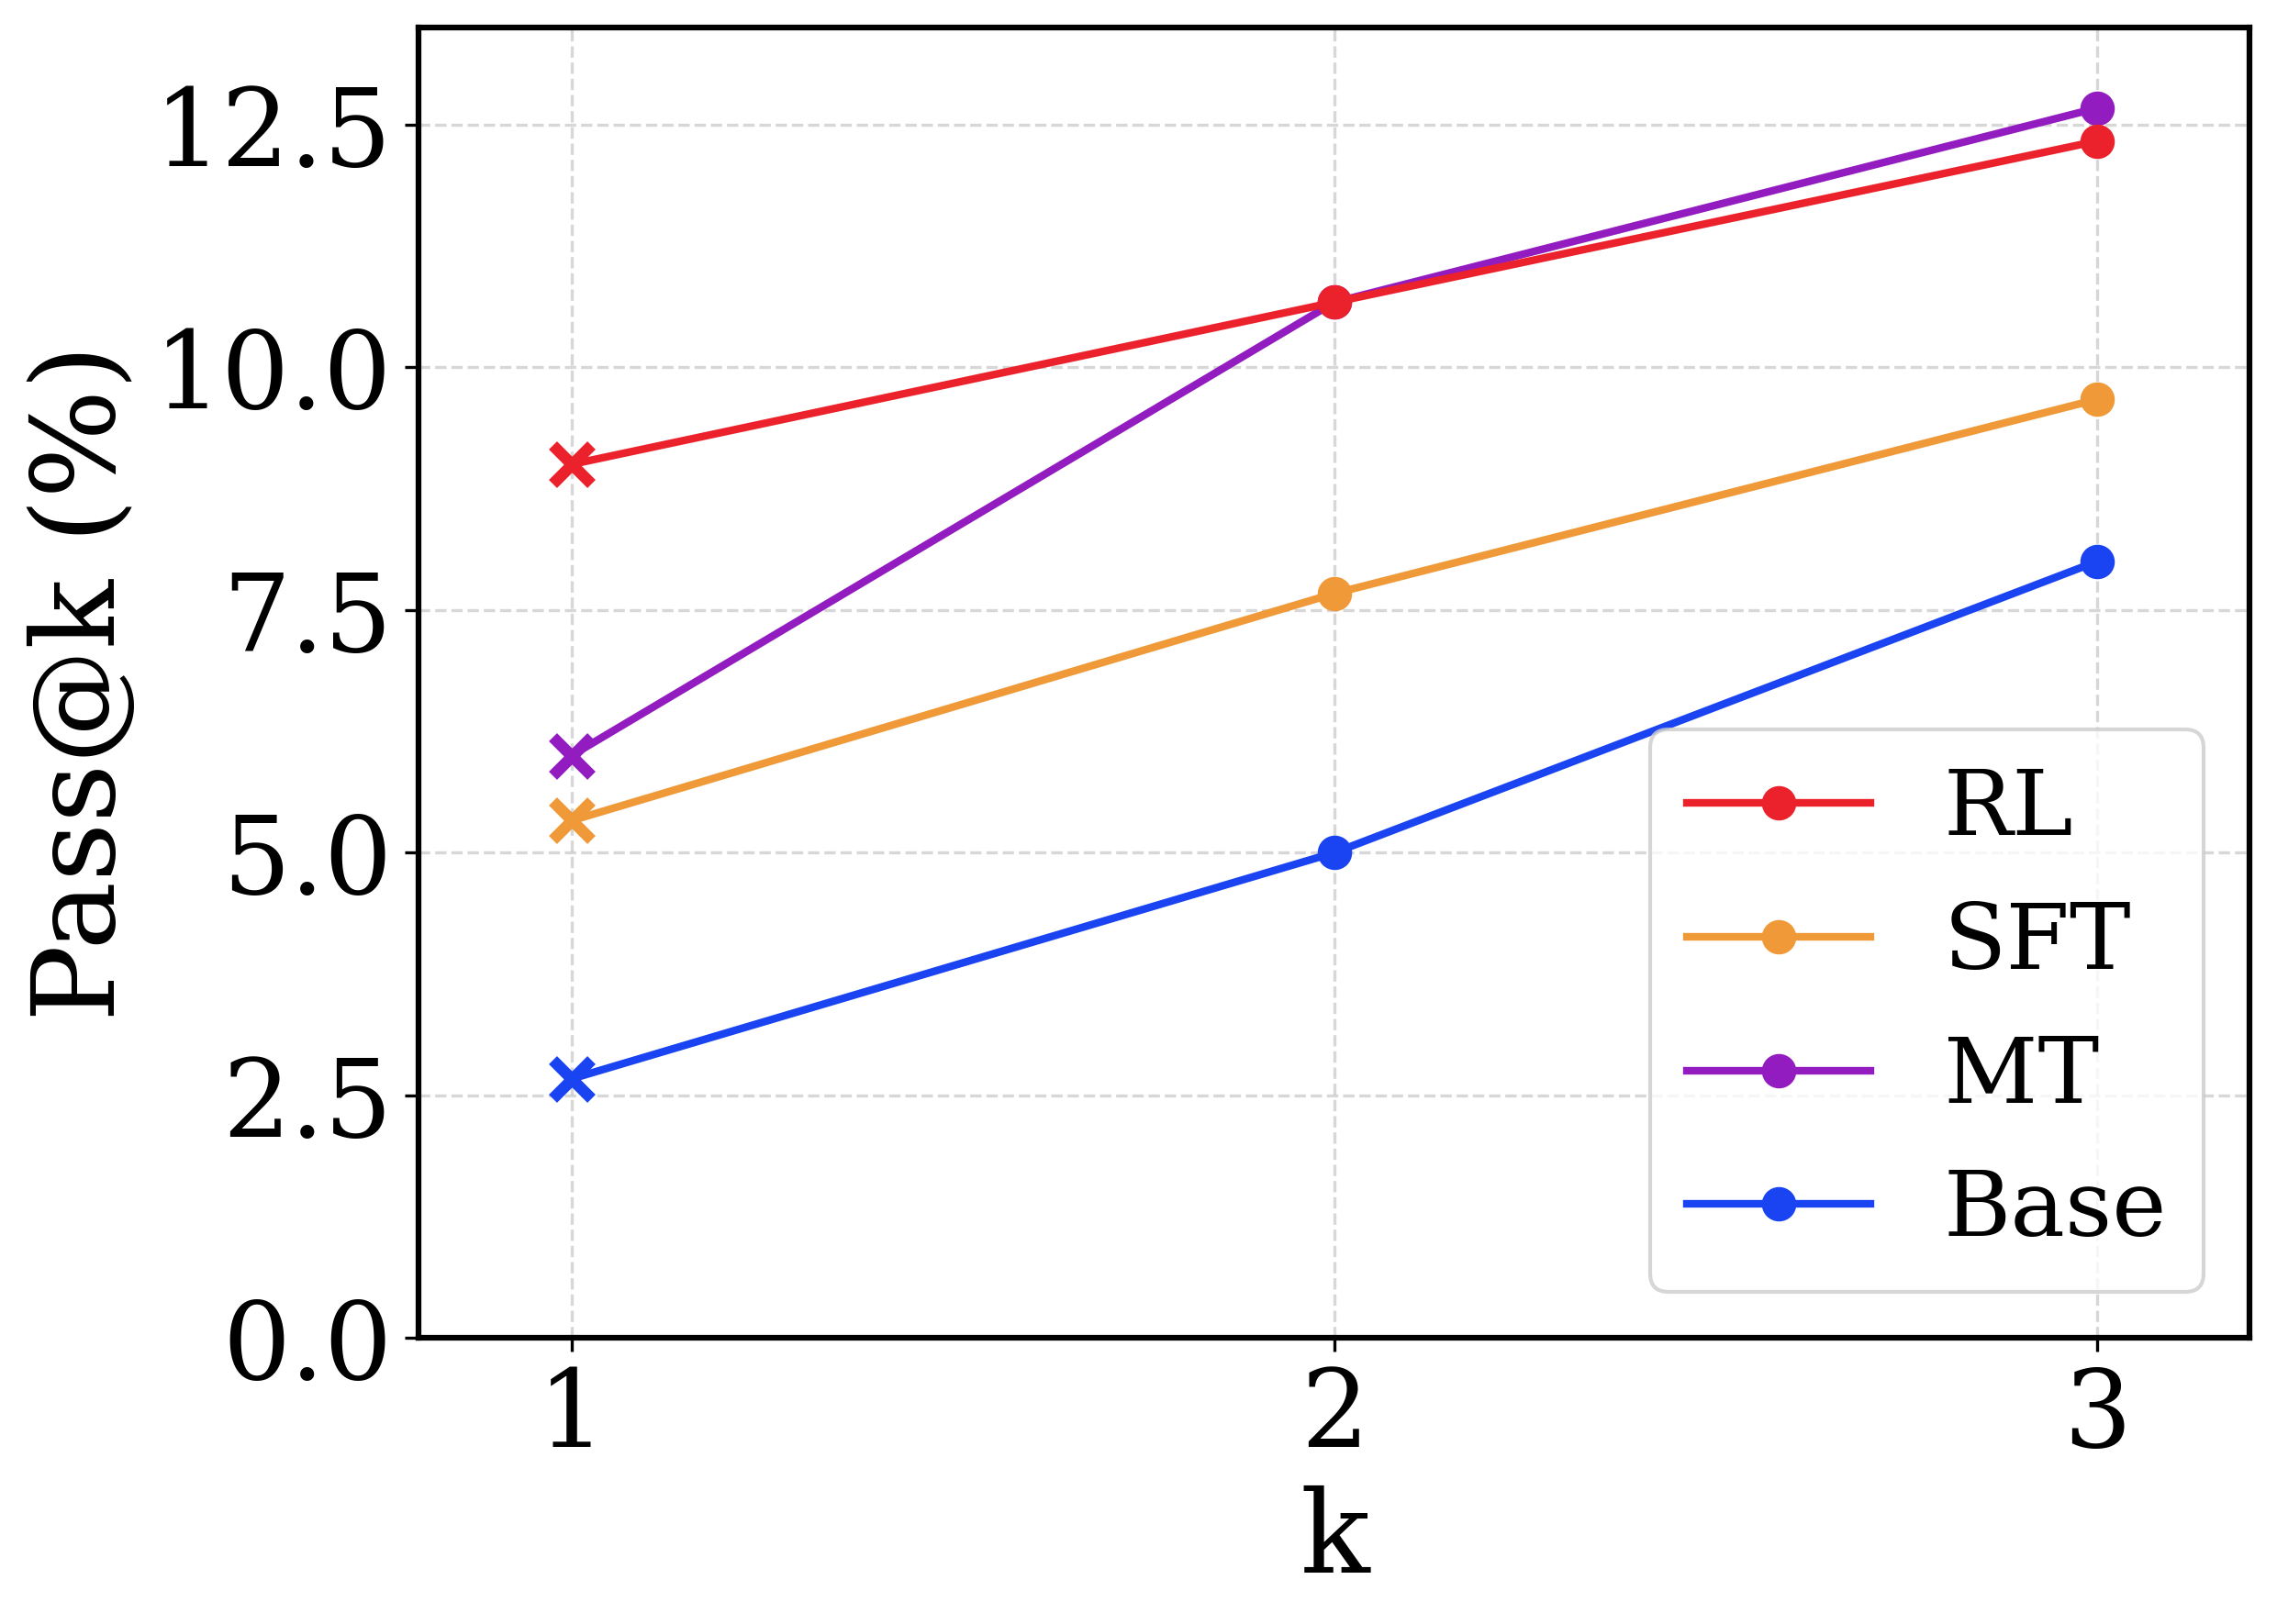
This image presents a line chart comparing the Pass@k metric (in percentage) for four different models (RL, SFT, MT, and Base) across three values of k (1, 2, and 3). The chart illustrates how the performance of each model changes as the value of k increases.
### Components/Axes
* **X-axis:** Labeled "k", with values 1, 2, and 3.
* **Y-axis:** Labeled "Pass@k (%)", with a scale ranging from 0.0 to 12.5, incrementing by 2.5.
* **Legend:** Located in the top-right corner, identifying the four data series:
* RL (Red)
* SFT (Orange)
* MT (Magenta)
* Base (Blue)
### Detailed Analysis
Let's analyze each line individually, noting trends and approximate data points.
* **RL (Red):** The line slopes upward, indicating increasing Pass@k with increasing k.
* k=1: Approximately 8.8%
* k=2: Approximately 10.8%
* k=3: Approximately 12.3%
* **SFT (Orange):** The line also slopes upward, but less steeply than RL.
* k=1: Approximately 5.2%
* k=2: Approximately 7.8%
* k=3: Approximately 9.6%
* **MT (Magenta):** This line shows a significant upward slope, and appears to be the highest performing model at k=2 and k=3.
* k=1: Approximately 6.2%
* k=2: Approximately 10.2%
* k=3: Approximately 12.2%
* **Base (Blue):** The line slopes upward, but is the flattest of the four, indicating the smallest increase in Pass@k with increasing k.
* k=1: Approximately 2.5%
* k=2: Approximately 5.0%
* k=3: Approximately 7.6%
### Key Observations
* The MT model consistently outperforms the other models at k=2 and k=3.
* The Base model has the lowest Pass@k values across all k values.
* All models show an increase in Pass@k as k increases, suggesting that considering more top-k predictions improves performance.
* The RL model shows the most significant improvement in Pass@k as k increases.
### Interpretation
The chart demonstrates the impact of the 'k' parameter on the Pass@k metric for different models. Pass@k represents the percentage of times the correct answer is within the top 'k' predicted results. The results suggest that increasing 'k' generally improves performance, as a wider range of predictions increases the likelihood of including the correct answer. The differences between the models indicate varying levels of confidence and accuracy in their predictions. The MT model's superior performance suggests it is better at generating a diverse set of plausible answers, increasing the chance of including the correct one within the top 'k' predictions. The Base model's lower performance suggests it may be less capable of generating diverse or accurate predictions. The steep slope of the RL model indicates that it benefits significantly from considering more predictions (larger k). This data could be used to optimize the choice of 'k' for each model to achieve a desired level of performance.