## Line Chart: Pass@k Performance Comparison
### Overview
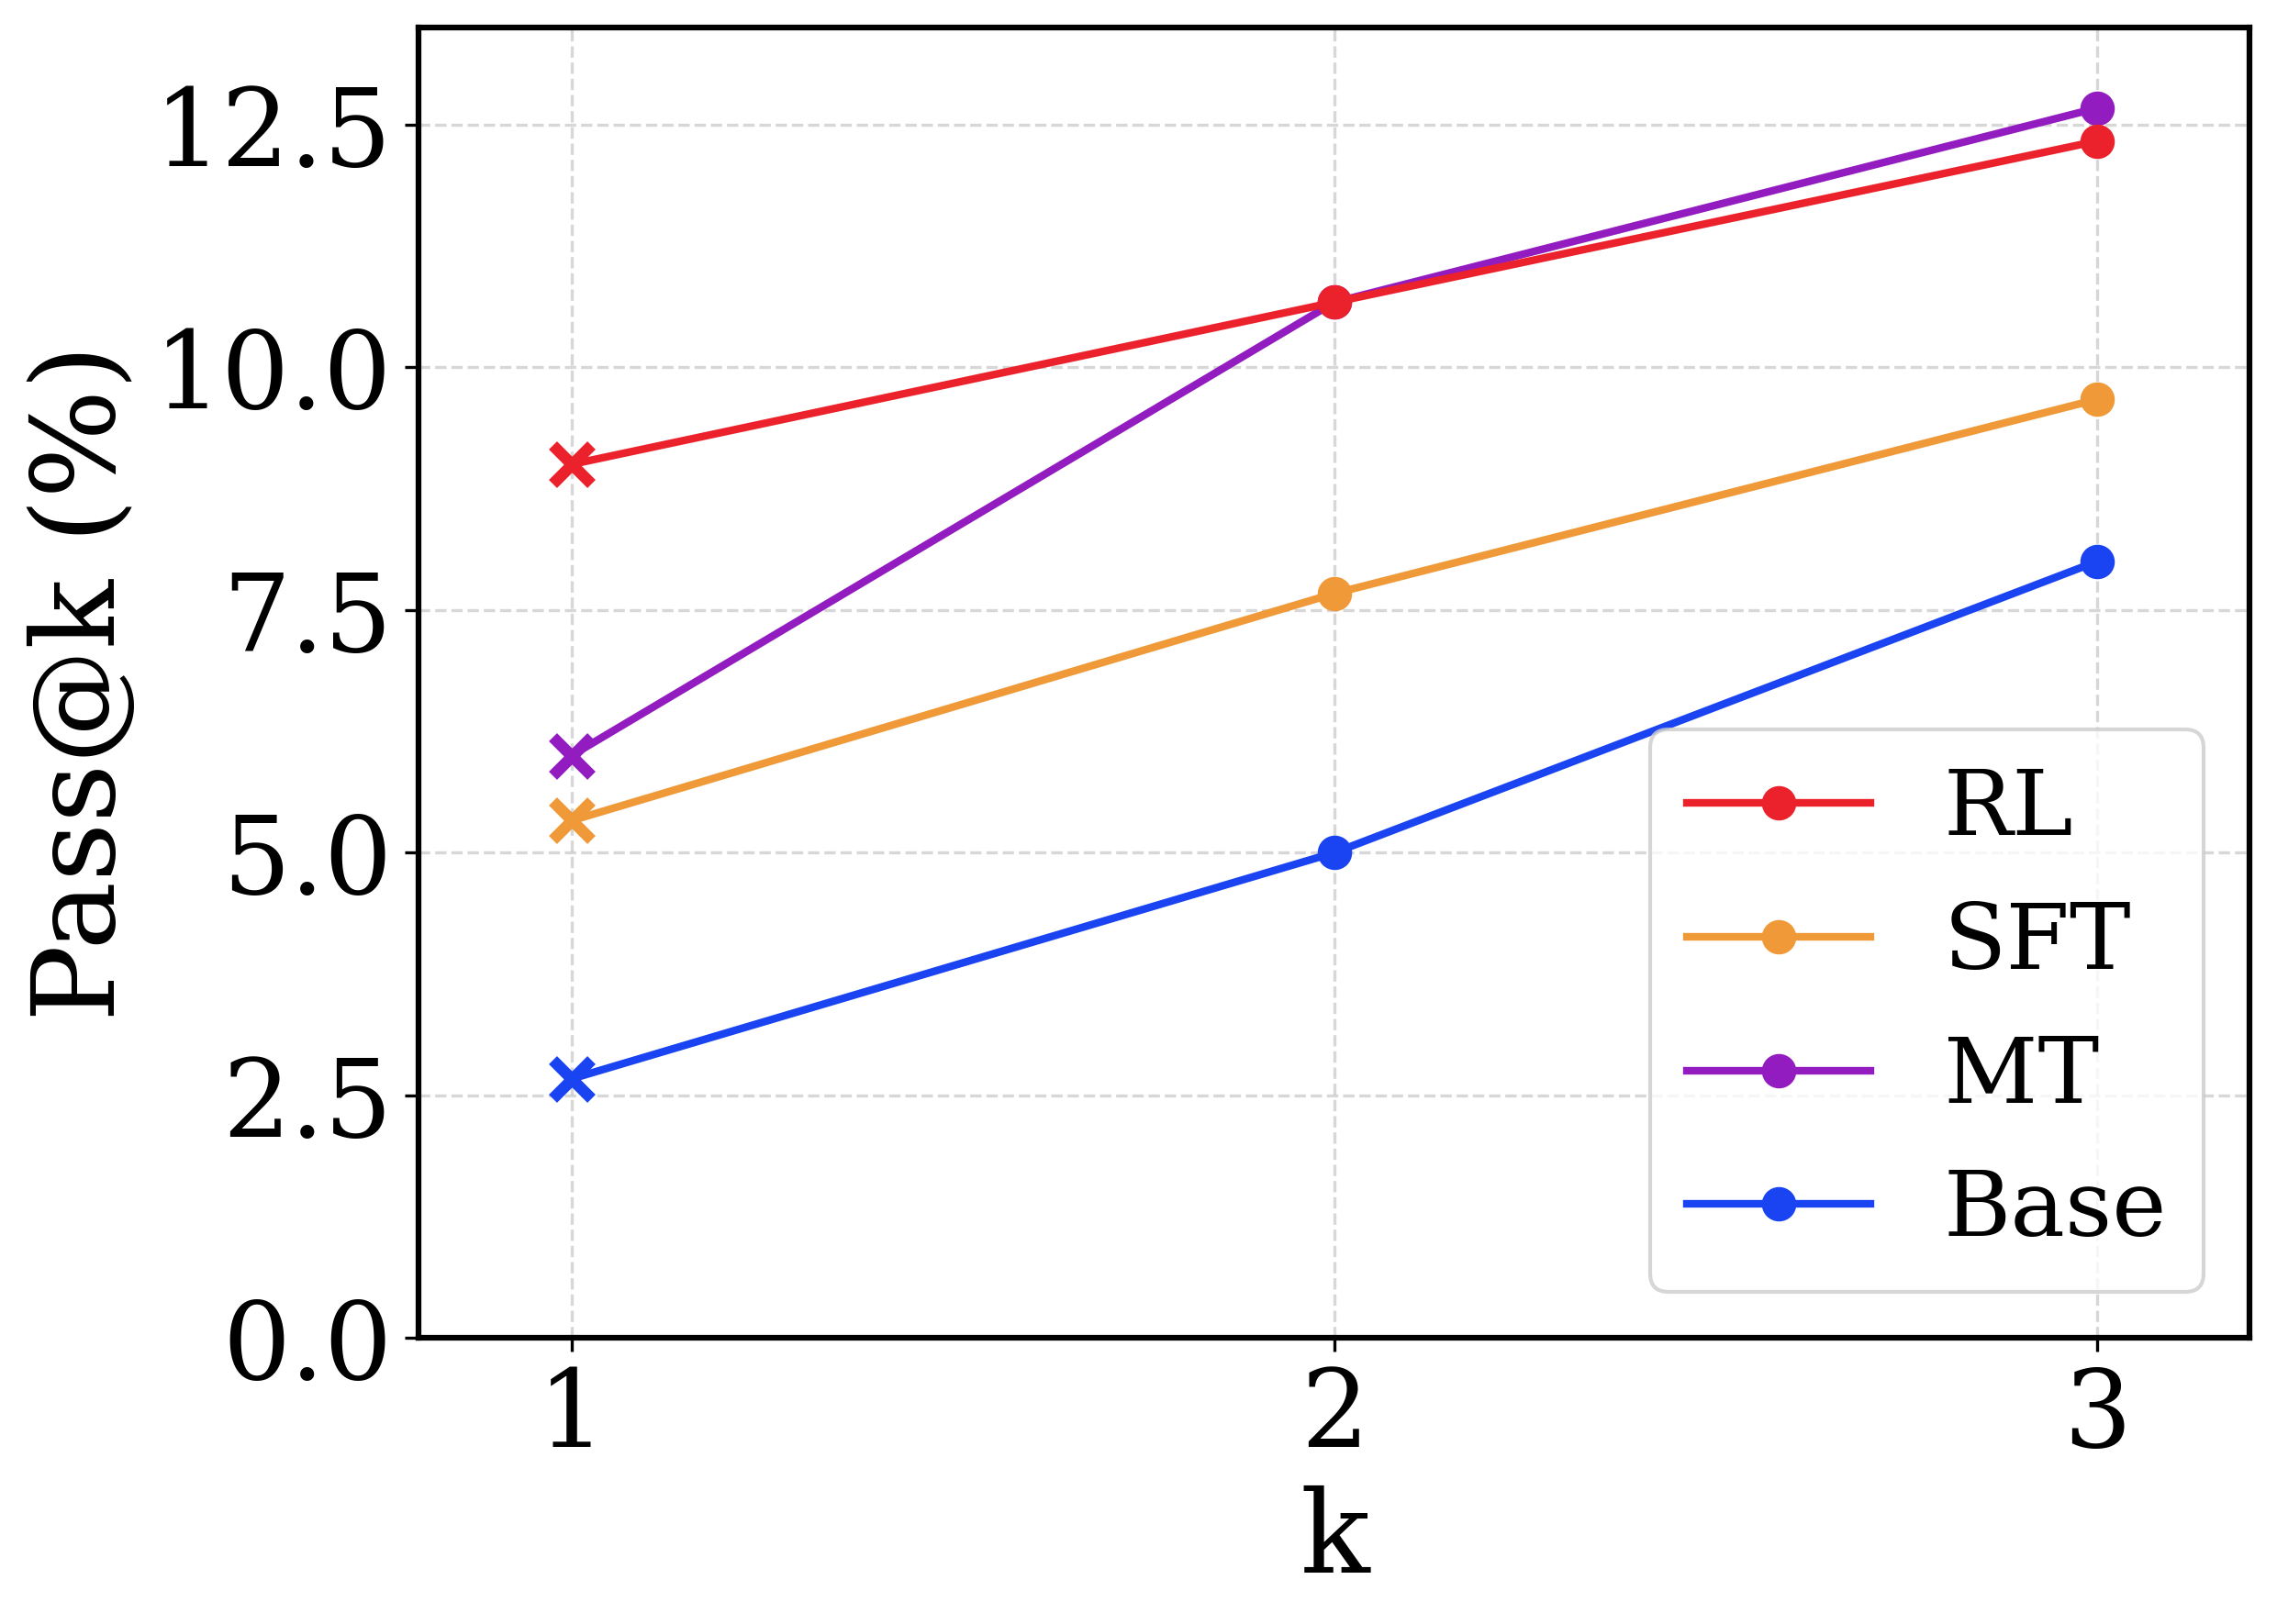
This is a line chart comparing the performance of four different methods (RL, SFT, MT, Base) on a metric called "Pass@k (%)". The chart plots this metric against increasing values of "k" (1, 2, and 3). All four methods show an upward trend as k increases.
### Components/Axes
* **X-Axis:** Labeled "k". It has three discrete, evenly spaced tick marks at values 1, 2, and 3.
* **Y-Axis:** Labeled "Pass@k (%)". The scale runs from 0.0 to 12.5, with major grid lines at intervals of 2.5 (0.0, 2.5, 5.0, 7.5, 10.0, 12.5).
* **Legend:** Located in the bottom-right quadrant of the chart area. It contains four entries, each with a colored line and marker symbol:
* **RL:** Red line with a circle marker.
* **SFT:** Orange line with a circle marker.
* **MT:** Purple line with a circle marker.
* **Base:** Blue line with a circle marker.
* **Data Markers:** Each data series uses an 'x' marker at k=1 and a circle marker at k=2 and k=3.
### Detailed Analysis
The chart displays the following approximate data points for each method. The trend for all series is a positive slope, indicating Pass@k increases with k.
**1. RL (Red Line):**
* **Trend:** Slopes upward steadily.
* **Data Points:**
* k=1: ~9.0% (marked with a red 'x')
* k=2: ~10.5% (red circle)
* k=3: ~12.2% (red circle)
**2. SFT (Orange Line):**
* **Trend:** Slopes upward steadily, with a slope less steep than RL and MT.
* **Data Points:**
* k=1: ~5.5% (orange 'x')
* k=2: ~7.6% (orange circle)
* k=3: ~9.6% (orange circle)
**3. MT (Purple Line):**
* **Trend:** Slopes upward with the steepest incline of all series. It starts below RL but surpasses it by k=3.
* **Data Points:**
* k=1: ~6.0% (purple 'x')
* k=2: ~10.5% (purple circle) - intersects with RL at this point.
* k=3: ~12.7% (purple circle) - the highest value on the chart.
**4. Base (Blue Line):**
* **Trend:** Slopes upward steadily, maintaining the lowest performance across all k values.
* **Data Points:**
* k=1: ~2.7% (blue 'x')
* k=2: ~5.0% (blue circle)
* k=3: ~7.9% (blue circle)
### Key Observations
1. **Universal Improvement:** All four methods show improved Pass@k scores as k increases from 1 to 3.
2. **MT's Steep Ascent:** The MT method exhibits the most dramatic improvement, nearly doubling its score from k=1 to k=3 and achieving the highest overall score at k=3.
3. **RL vs. MT Crossover:** RL starts as the top performer at k=1. MT catches up to RL at k=2 (both ~10.5%) and then surpasses it at k=3.
4. **Consistent Hierarchy at k=1:** At the starting point (k=1), the performance order from highest to lowest is clearly RL > MT > SFT > Base.
5. **Base as Lower Bound:** The Base method consistently performs the worst but shows a similar rate of improvement to SFT.
### Interpretation
The chart demonstrates the effectiveness of different training or prompting strategies (RL, SFT, MT) compared to a Base model on a task where performance is measured by the probability of getting at least one correct answer in `k` attempts (Pass@k).
* **The value of `k`:** Increasing `k` (allowing more attempts) universally improves the chance of success for all methods, which is an expected outcome.
* **Method Efficacy:** All advanced methods (RL, SFT, MT) significantly outperform the Base model at every `k` value, indicating their added value.
* **Strategic Implications:** The choice of optimal method may depend on the operational constraint for `k`. If only one attempt is allowed (`k=1`), RL is the best choice. However, if multiple attempts are feasible (`k=3`), MT becomes the most effective strategy, suggesting it may be better at generating diverse or high-quality candidate solutions that pay off when more chances are given. The steep slope of MT implies its outputs have higher variance or a better "top-k" distribution, making it more likely to contain a correct answer when more samples are drawn.
* **SFT's Position:** SFT provides a solid improvement over Base but is consistently outperformed by RL and MT, suggesting that reinforcement learning (RL) or the specific technique used in MT offers advantages beyond supervised fine-tuning alone for this metric.