# Technical Document Extraction: Line Chart Analysis
## Chart Overview
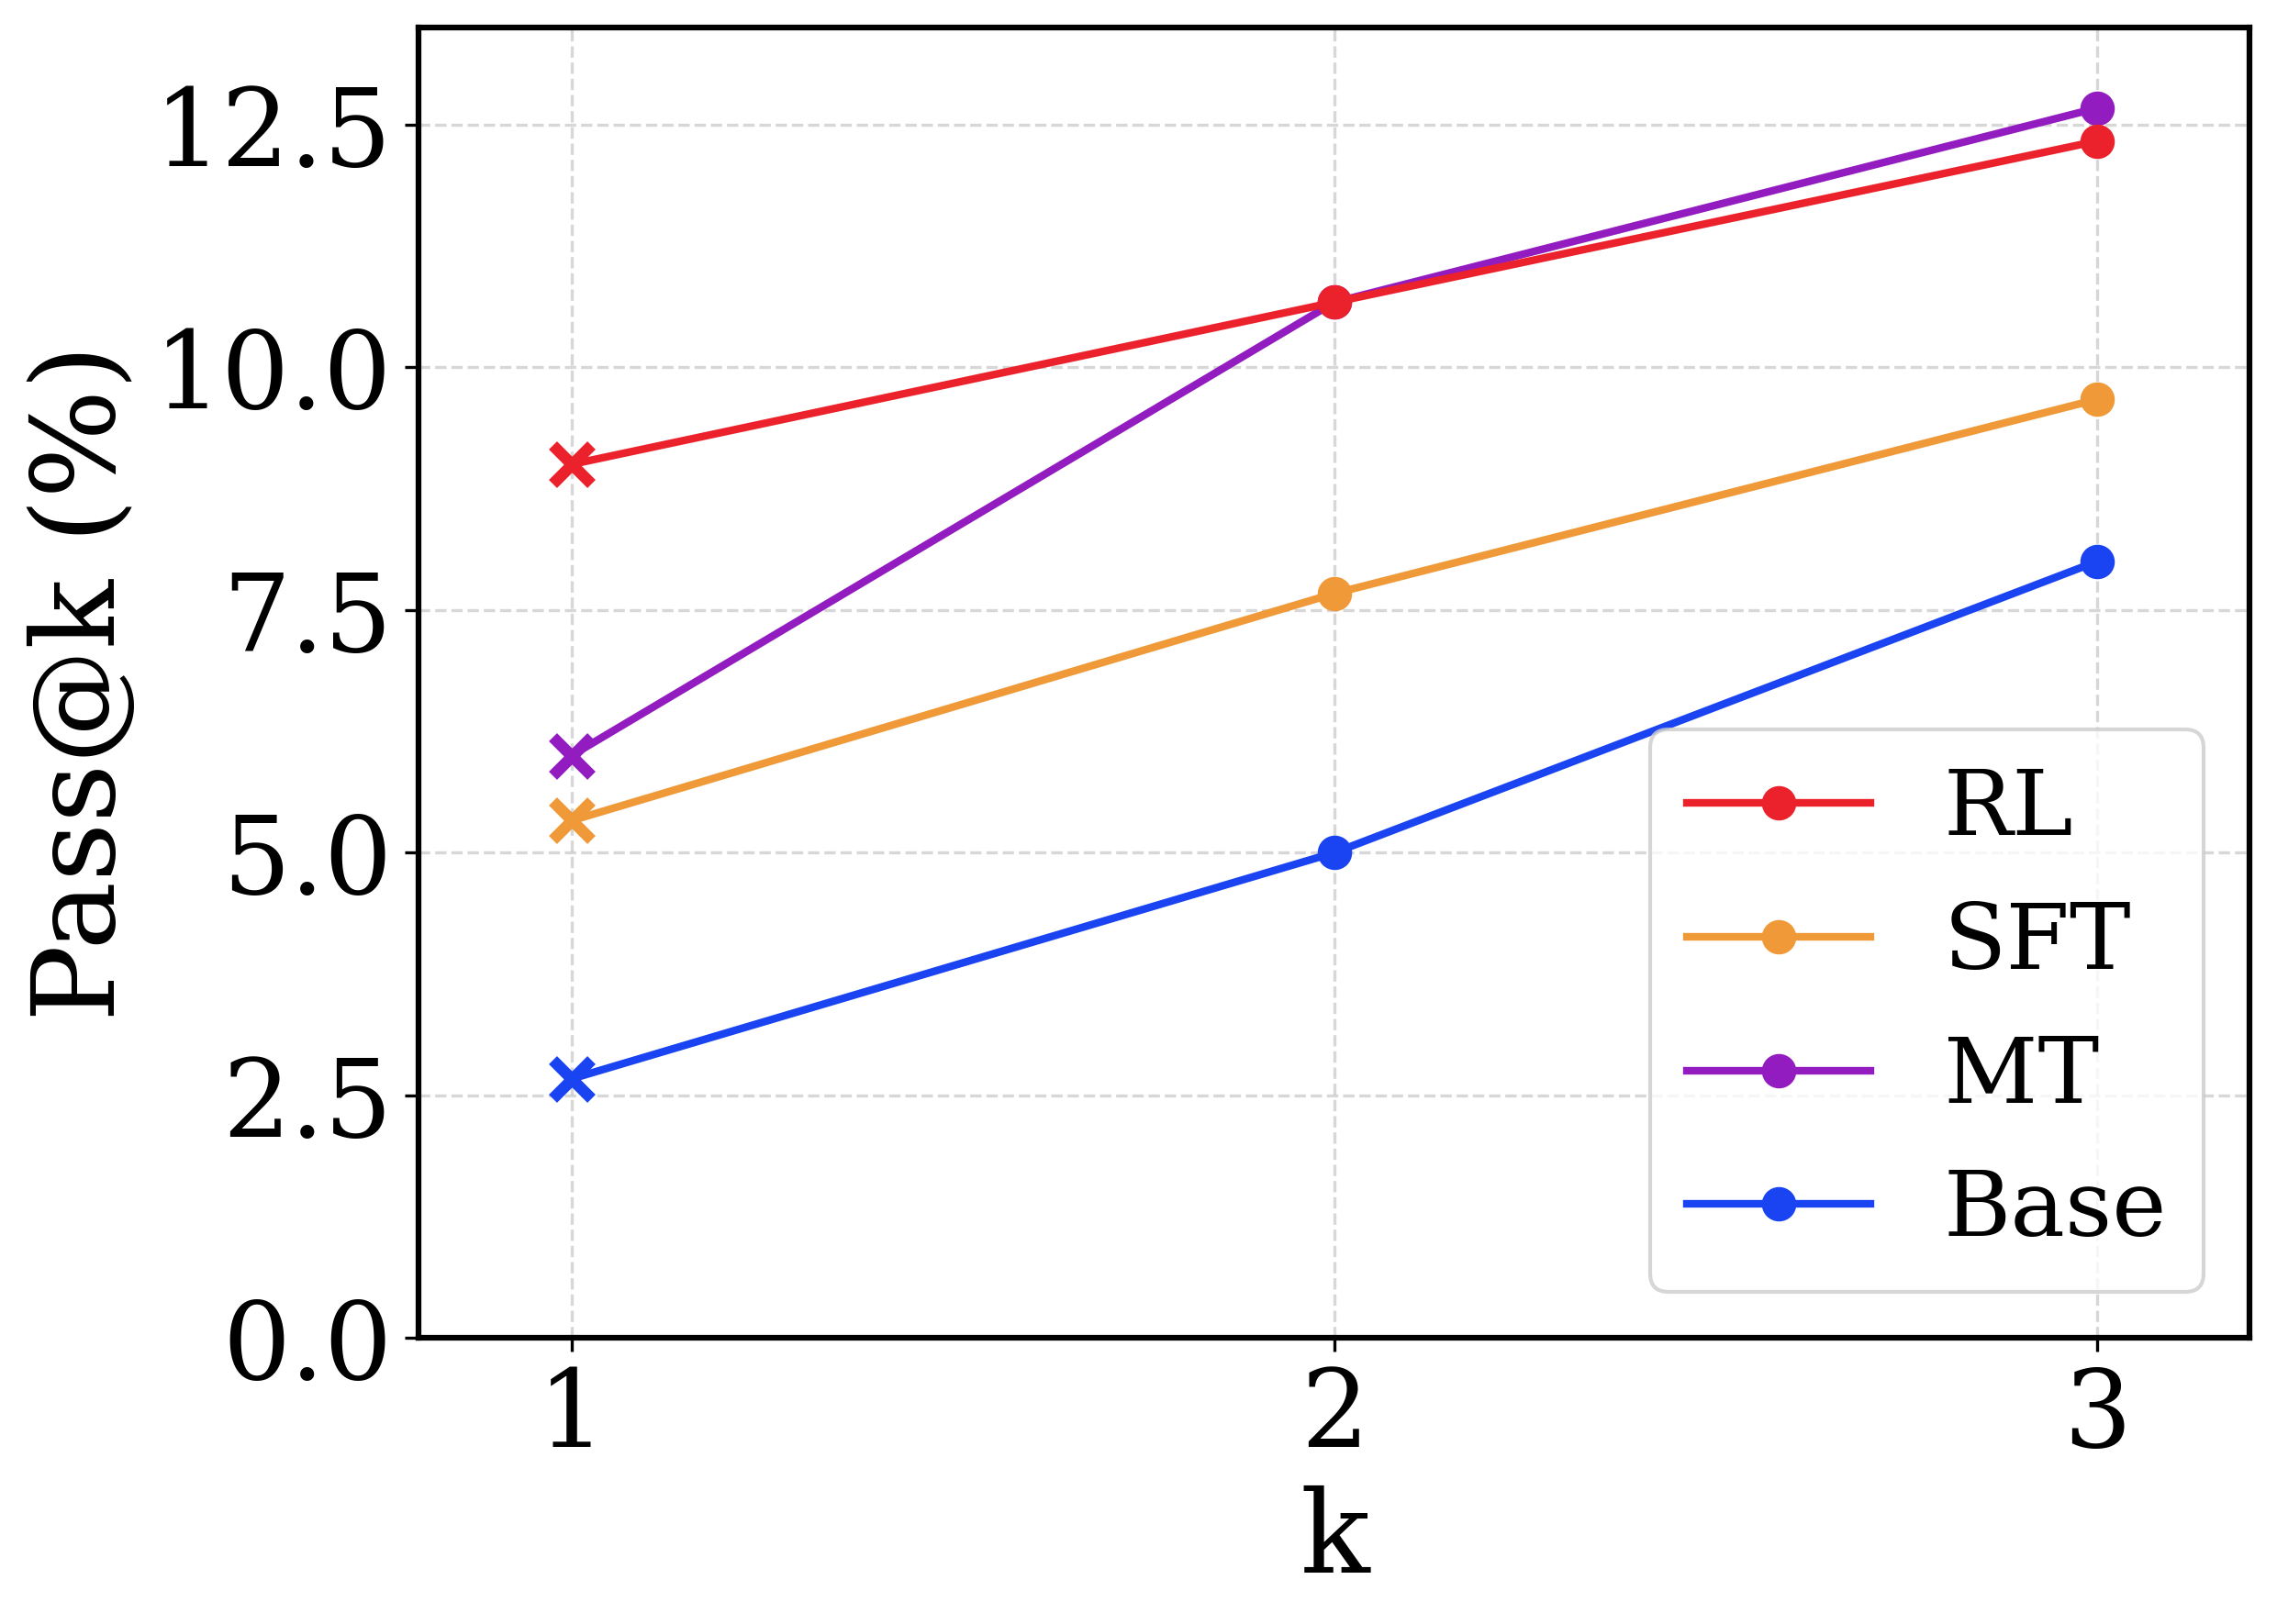
The image depicts a line chart comparing four performance metrics across three data points (k=1, 2, 3). The y-axis represents "Pass@k (%)" with a range of 0.0 to 12.5, while the x-axis represents discrete values of k (1, 2, 3).
## Axis Labels
- **X-axis**: `k` (discrete values: 1, 2, 3)
- **Y-axis**: `Pass@k (%)` (range: 0.0 to 12.5)
## Legend
The legend is positioned on the right side of the chart and maps colors to labels:
- **Red**: RL (Reinforcement Learning)
- **Orange**: SFT (Softmax Fine-Tuning)
- **Purple**: MT (Model Tuning)
- **Blue**: Base (Baseline)
## Data Series Analysis
### RL (Red Line)
- **Trend**: Steady upward slope
- **Data Points**:
- k=1: 9.0%
- k=2: 10.5%
- k=3: 12.3%
### SFT (Orange Line)
- **Trend**: Gradual linear increase
- **Data Points**:
- k=1: 5.2%
- k=2: 7.8%
- k=3: 9.7%
### MT (Purple Line)
- **Trend**: Accelerated growth (overtakes RL at k=2)
- **Data Points**:
- k=1: 6.0%
- k=2: 10.5%
- k=3: 12.7%
### Base (Blue Line)
- **Trend**: Slowest linear progression
- **Data Points**:
- k=1: 2.8%
- k=2: 5.0%
- k=3: 8.0%
## Spatial Grounding
- **Legend Position**: Right-aligned, outside the main chart area
- **Color Consistency**: All data points match their corresponding legend colors (e.g., red markers for RL, orange for SFT).
## Key Observations
1. **Performance Gaps**:
- At k=1, RL (9.0%) outperforms MT (6.0%) and SFT (5.2%) by 3-4 percentage points.
- At k=3, MT (12.7%) surpasses RL (12.3%) by 0.4 percentage points.
2. **Baseline Comparison**:
- Base (blue) remains consistently 3-5 percentage points below SFT across all k values.
3. **MT's Acceleration**:
- MT's growth rate doubles between k=1→2 (4.5% increase) vs. k=2→3 (2.2% increase), suggesting diminishing returns.
## Data Table Reconstruction
| k | RL (%) | SFT (%) | MT (%) | Base (%) |
|----|--------|---------|--------|----------|
| 1 | 9.0 | 5.2 | 6.0 | 2.8 |
| 2 | 10.5 | 7.8 | 10.5 | 5.0 |
| 3 | 12.3 | 9.7 | 12.7 | 8.0 |
## Conclusion
The chart demonstrates that MT achieves the highest Pass@k performance at k=3, while RL maintains the second-highest performance throughout. SFT shows moderate improvement, and Base remains the weakest performer across all k values.