## Diagram: Distribution of 64 Selected Articles by Publication Type and Year
### Overview
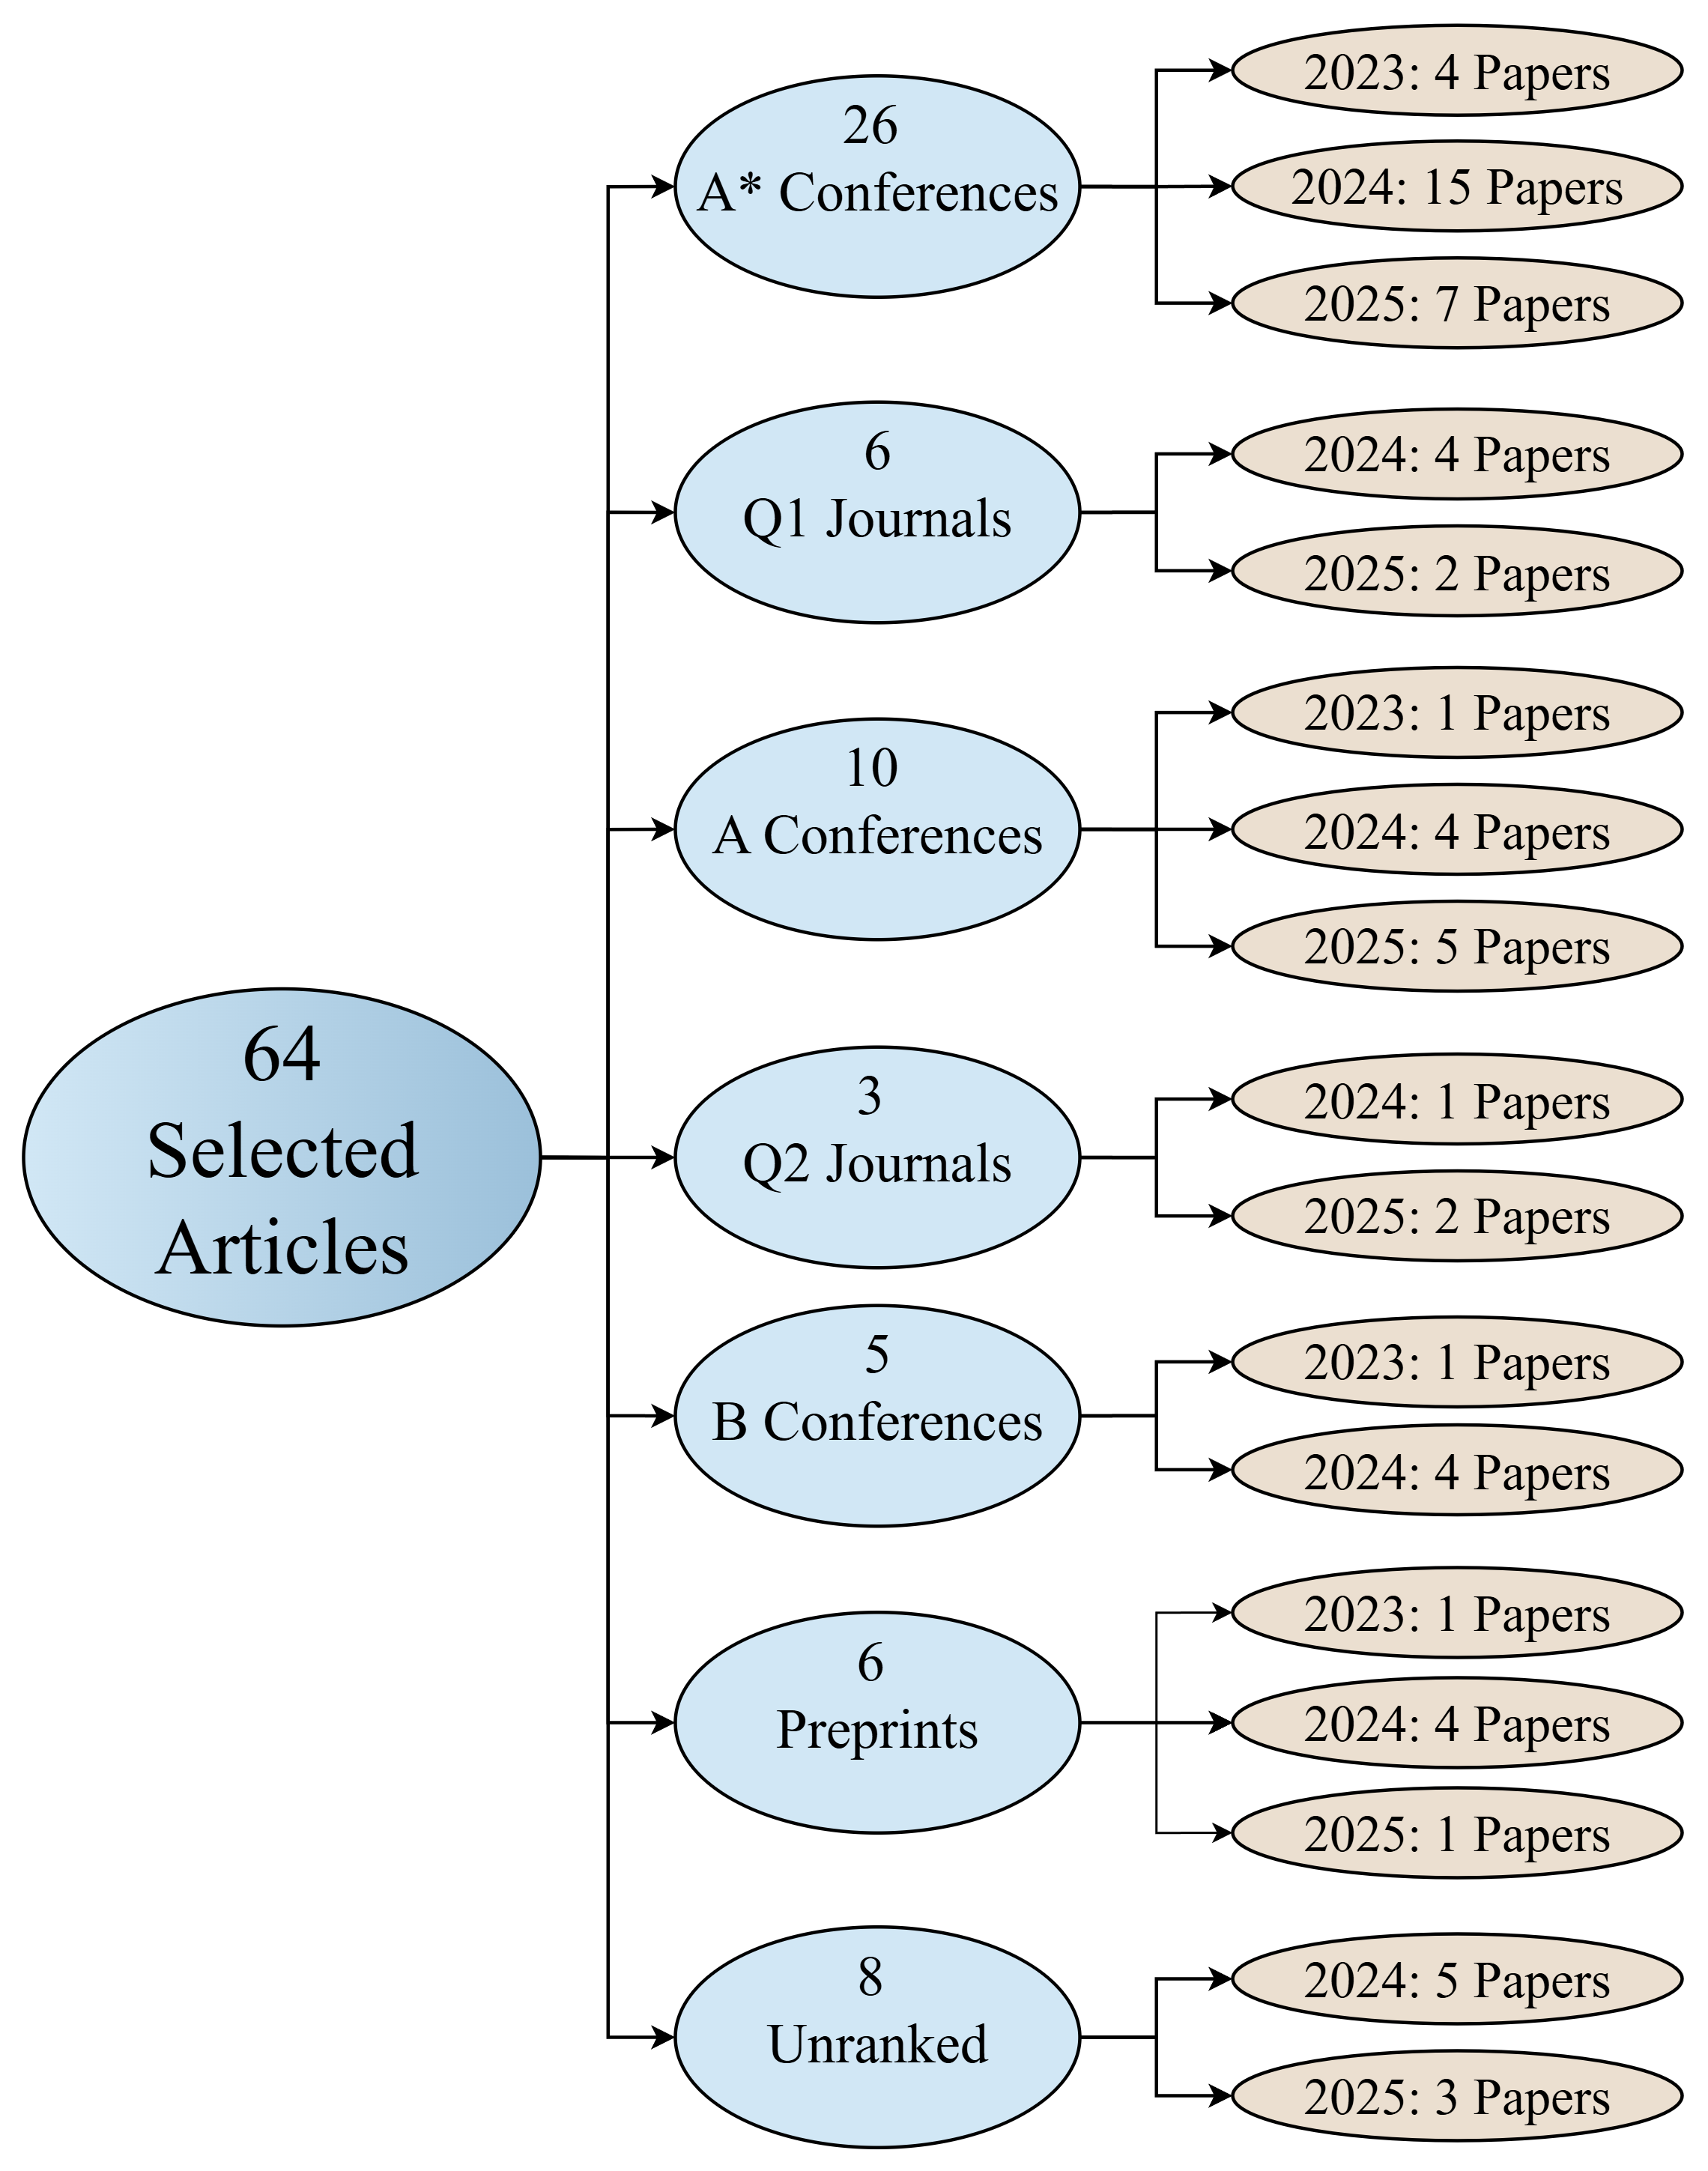
This image is a hierarchical tree diagram (flowchart) illustrating the categorization and temporal distribution of 64 selected academic articles. The diagram flows from a single root node on the left, branching into eight distinct publication type categories in the center, which further branch into specific year-based paper counts on the right. The structure provides a clear breakdown of the dataset's composition.
### Components/Axes
* **Root Node (Left):** A large, light blue oval labeled "64 Selected Articles". This is the source of all data.
* **Primary Categories (Center Column):** Eight light blue ovals, each connected by an arrow from the root node. Each oval contains a count and a publication type label.
* **Yearly Breakdowns (Right Column):** Smaller, light beige ovals connected by arrows from their respective primary category. Each contains a year (2023, 2024, or 2025) and the corresponding number of papers.
* **Flow Direction:** Arrows indicate a left-to-right flow from the total set, to publication type, to yearly distribution within that type.
* **Color Coding:**
* Light Blue: Used for the root node and all primary publication type categories.
* Light Beige: Used for all nodes representing yearly paper counts.
### Detailed Analysis
The diagram explicitly lists the following data points:
**1. Primary Categories and Their Yearly Distributions:**
* **26 A* Conferences**
* 2023: 4 Papers
* 2024: 15 Papers
* 2025: 7 Papers
* **6 Q1 Journals**
* 2024: 4 Papers
* 2025: 2 Papers
* **10 A Conferences**
* 2023: 1 Papers
* 2024: 4 Papers
* 2025: 5 Papers
* **3 Q2 Journals**
* 2024: 1 Papers
* 2025: 2 Papers
* **5 B Conferences**
* 2023: 1 Papers
* 2024: 4 Papers
* **6 Preprints**
* 2023: 1 Papers
* 2024: 4 Papers
* 2025: 1 Papers
* **8 Unranked**
* 2024: 5 Papers
* 2025: 3 Papers
**2. Aggregate Yearly Totals (Calculated from the diagram):**
* **2023 Total:** 4 (A*) + 1 (A) + 1 (B) + 1 (Preprints) = **7 Papers**
* **2024 Total:** 15 (A*) + 4 (Q1) + 4 (A) + 1 (Q2) + 4 (B) + 4 (Preprints) + 5 (Unranked) = **37 Papers**
* **2025 Total:** 7 (A*) + 2 (Q1) + 5 (A) + 2 (Q2) + 1 (Preprints) + 3 (Unranked) = **20 Papers**
* **Grand Total Verification:** 7 + 37 + 20 = 64, which matches the root node.
### Key Observations
1. **Dominant Category:** "A* Conferences" is the largest single category, containing 26 of the 64 articles (40.6%).
2. **Peak Year:** The year 2024 contains the majority of the papers (37 out of 64, or 57.8%), indicating a significant concentration of selected work from that year.
3. **Temporal Trends by Category:**
* **A* Conferences:** Shows a sharp peak in 2024 (15 papers) compared to 2023 (4) and 2025 (7).
* **A Conferences:** Shows a steady increasing trend from 2023 (1) to 2024 (4) to 2025 (5).
* **Q1 Journals & Q2 Journals:** Have no papers listed for 2023.
* **B Conferences:** Has no papers listed for 2025.
4. **Data Completeness:** Not all categories have entries for all three years (2023, 2024, 2025). The "Unranked" and "Q2 Journals" categories have no 2023 entries.
### Interpretation
This diagram serves as a **provenance and composition summary** for a research corpus or literature review. It answers the questions: "Where did these 64 articles come from?" and "When were they published?"
* **What the data suggests:** The selection heavily favors top-tier, peer-reviewed venues (A* and A Conferences, Q1 Journals), which together account for 42 of the 64 articles (65.6%). The inclusion of Preprints and Unranked sources suggests a comprehensive search strategy that also captures emerging or non-traditional scholarship.
* **How elements relate:** The tree structure explicitly shows the hierarchical relationship between the total set, its constituent parts by venue prestige/type, and their publication timeline. It allows a viewer to quickly assess both the breadth of sources and their temporal distribution.
* **Notable patterns:** The pronounced peak in 2024 across multiple categories (especially A* Conferences) could indicate several things: a surge in research output on the topic that year, a deliberate selection bias towards recent work, or that 2024 represents the most recent complete year of data at the time of the diagram's creation. The absence of 2023 data from several journal categories might suggest those venues have longer review cycles, or that relevant 2023 journal articles were not identified or selected for this particular set.