## Flowchart: Distribution of Selected Articles Across Publication Venues and Years
### Overview
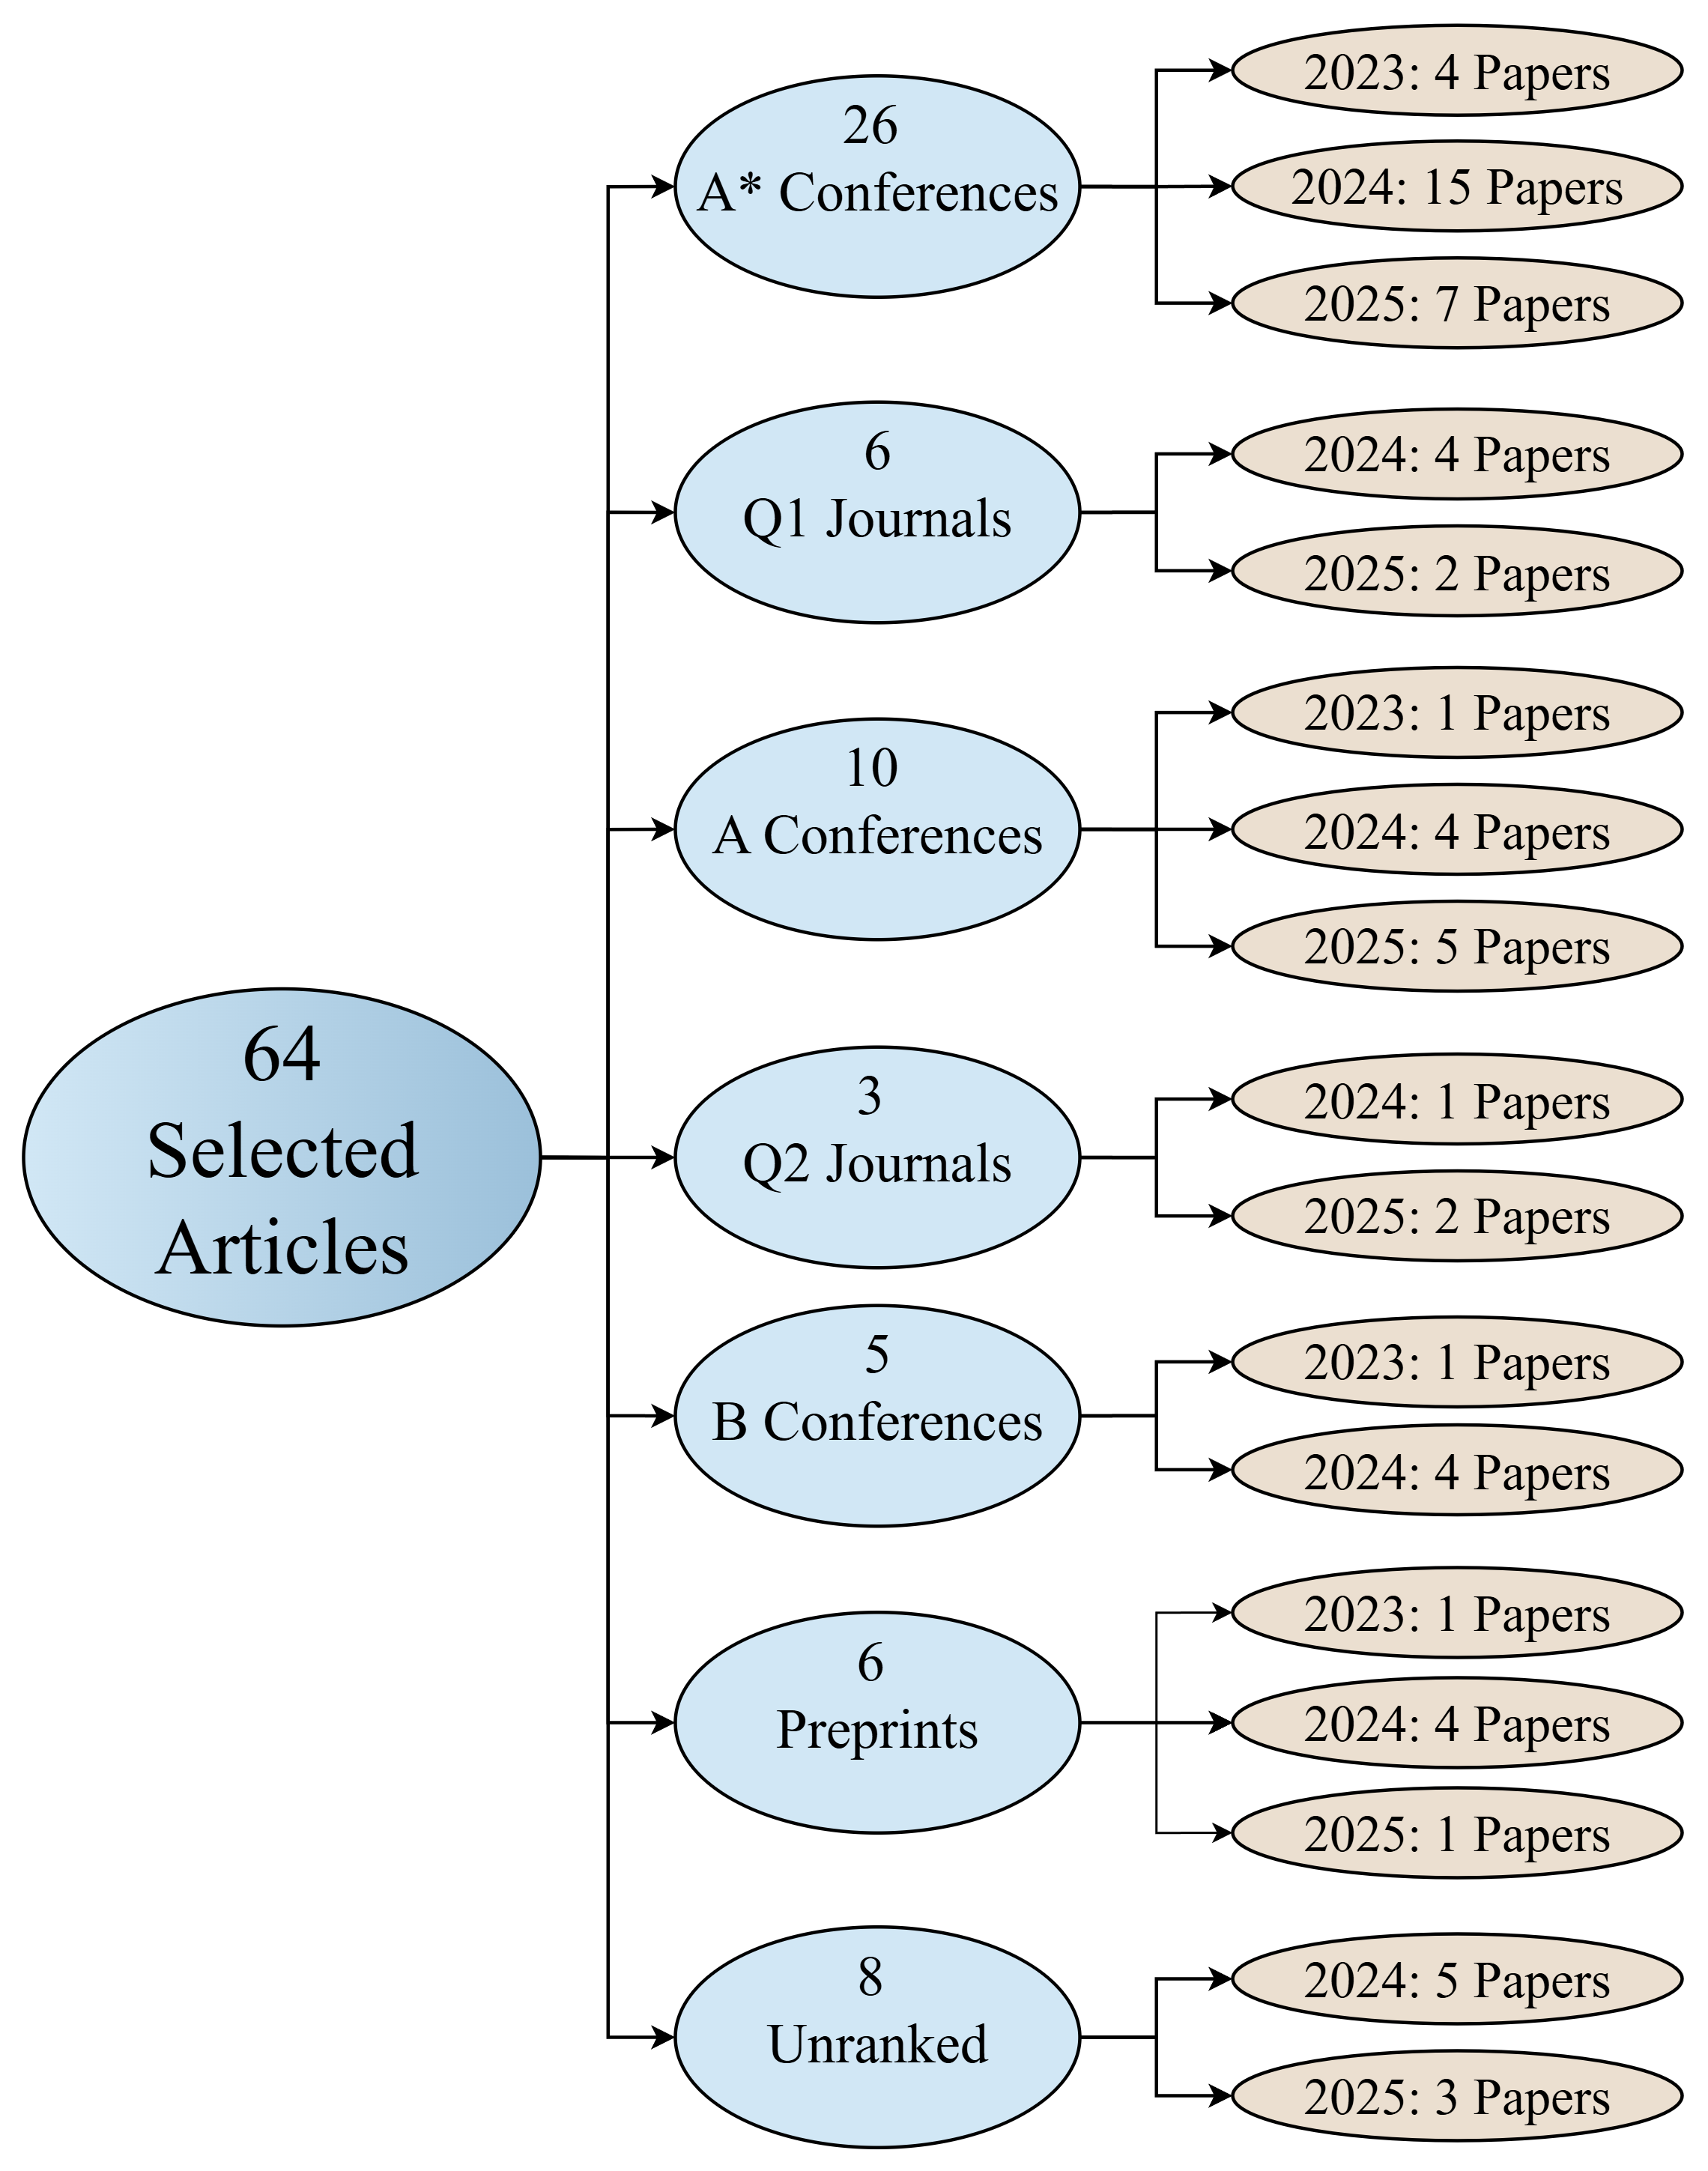
The flowchart illustrates the distribution of 64 selected articles across six publication categories (A* Conferences, Q1 Journals, A Conferences, Q2 Journals, B Conferences, Preprints, and Unranked) and their publication years (2023–2025). Each category is connected to subcategories representing specific years and paper counts, with numerical labels indicating total contributions per category.
### Components/Axes
- **Main Categories (Left Branch)**:
- A* Conferences (26 total)
- Q1 Journals (6 total)
- A Conferences (10 total)
- Q2 Journals (3 total)
- B Conferences (5 total)
- Preprints (6 total)
- Unranked (8 total)
- **Subcategories (Right Branch)**:
- Years: 2023, 2024, 2025
- Paper counts per year (e.g., "2023: 4 Papers")
- **Color Coding**:
- Blue ovals for main categories
- Beige ovals for subcategories
### Detailed Analysis
1. **A* Conferences (26 total)**:
- 2023: 4 Papers
- 2024: 15 Papers (peak)
- 2025: 7 Papers
2. **Q1 Journals (6 total)**:
- 2024: 4 Papers
- 2025: 2 Papers
3. **A Conferences (10 total)**:
- 2023: 1 Paper
- 2024: 4 Papers
- 2025: 5 Papers
4. **Q2 Journals (3 total)**:
- 2024: 1 Paper
- 2025: 2 Papers
5. **B Conferences (5 total)**:
- 2023: 1 Paper
- 2024: 4 Papers
6. **Preprints (6 total)**:
- 2024: 4 Papers
- 2025: 1 Paper *(Note: Sum = 5, but main node claims 6. Likely data inconsistency.)*
7. **Unranked (8 total)**:
- 2024: 5 Papers
- 2025: 3 Papers
### Key Observations
- **Peak in 2024**: Most categories (A* Conferences, Q1 Journals, A Conferences, B Conferences, Unranked) show the highest paper counts in 2024.
- **Anomaly in Preprints**: The subcategory totals (4 + 1 = 5) do not match the main node value (6), suggesting a potential error in the data.
- **Declining Trend in A* Conferences**: A significant drop from 15 papers in 2024 to 7 in 2025.
- **Stable Output in Q2 Journals**: Consistent growth from 1 (2024) to 2 (2025) papers.
### Interpretation
The data suggests a strategic focus on high-impact venues (A* Conferences, Q1 Journals) in 2024, with a notable decline in A* Conference contributions by 2025. The Preprints category’s discrepancy highlights potential data entry errors, which could skew analysis. The Unranked category’s steady output (5 in 2024, 3 in 2025) indicates a baseline level of publication activity. Overall, the flowchart emphasizes a concentration of efforts in 2024, possibly reflecting annual priorities or funding cycles.