## Diagram: Hierarchical Processing Pipeline with VQ-VAE Decoder
### Overview
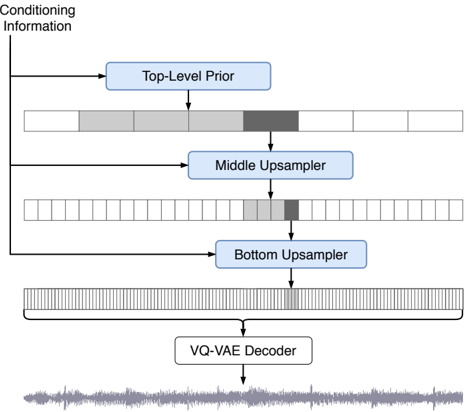
The diagram illustrates a hierarchical processing pipeline for generating or reconstructing data (likely audio waveforms) using a combination of conditioning information, upsampling layers, and a VQ-VAE decoder. The flow progresses from top-level conditioning to a final waveform output, with intermediate processing stages represented by shaded horizontal bars.
### Components/Axes
1. **Conditioning Information** (Top):
- A vertical line labeled "Conditioning Information" feeds into a "Top-Level Prior" block.
- Position: Top-left of the diagram.
2. **Horizontal Bars**:
- Three horizontal bars with varying shading (gray, darker gray, black) represent data layers or processing stages.
- **Top Bar**: Three segments (light gray → medium gray → black), decreasing in width from left to right.
- **Middle Bar**: Multiple narrow segments (light gray → medium gray → black), with the black segment centered.
- **Bottom Bar**: Dense light gray segments with a single black segment near the center.
3. **Processing Blocks**:
- **Top-Level Prior**: Receives conditioning information and outputs to the Middle Upsampler.
- **Middle Upsampler**: Processes data from the Top-Level Prior and feeds into the Bottom Upsampler.
- **Bottom Upsampler**: Final upsampling stage before the VQ-VAE Decoder.
- **VQ-VAE Decoder**: Outputs a waveform (bottom of the diagram).
4. **Waveform Output**:
- A noisy, oscillating waveform at the bottom, indicating the final generated/reconstructed signal.
### Detailed Analysis
- **Flow Direction**: Top-to-bottom hierarchy, with conditioning information cascading through upsamplers to the decoder.
- **Shading Interpretation**:
- Darker segments (black) likely represent critical or concentrated data points.
- Lighter segments (gray) may indicate less critical or distributed data.
- **Bar Structure**:
- Top Bar: Gradual transition from light to dark, possibly indicating a decay or focus of information.
- Middle Bar: Centralized black segment suggests a focal processing step.
- Bottom Bar: Single black segment amid dense gray, implying localized refinement.
### Key Observations
1. **Hierarchical Refinement**: Each upsampler progressively refines the data, with the Bottom Upsampler acting as a final preparatory step before decoding.
2. **VQ-VAE Role**: The decoder transforms processed data into a waveform, suggesting applications in audio generation or compression.
3. **Shading Ambiguity**: No explicit legend defines shading, but darker segments likely denote higher importance or intensity.
### Interpretation
This diagram represents a **multi-stage generative model** where conditioning information is iteratively processed through upsampling layers to produce a final output. The VQ-VAE decoder implies the use of discrete latent representations (common in VQ-VAEs) for efficient data generation. The shaded bars may visualize attention weights, data density, or transformation steps, with darker regions highlighting critical transformations. The absence of explicit numerical values suggests the diagram emphasizes architectural flow over quantitative metrics. The waveform output confirms the pipeline’s purpose in signal generation, likely for tasks like text-to-speech or audio synthesis.