## Bar Chart: Tacit Knowledge Brainstorm (Open-Ended)
### Overview
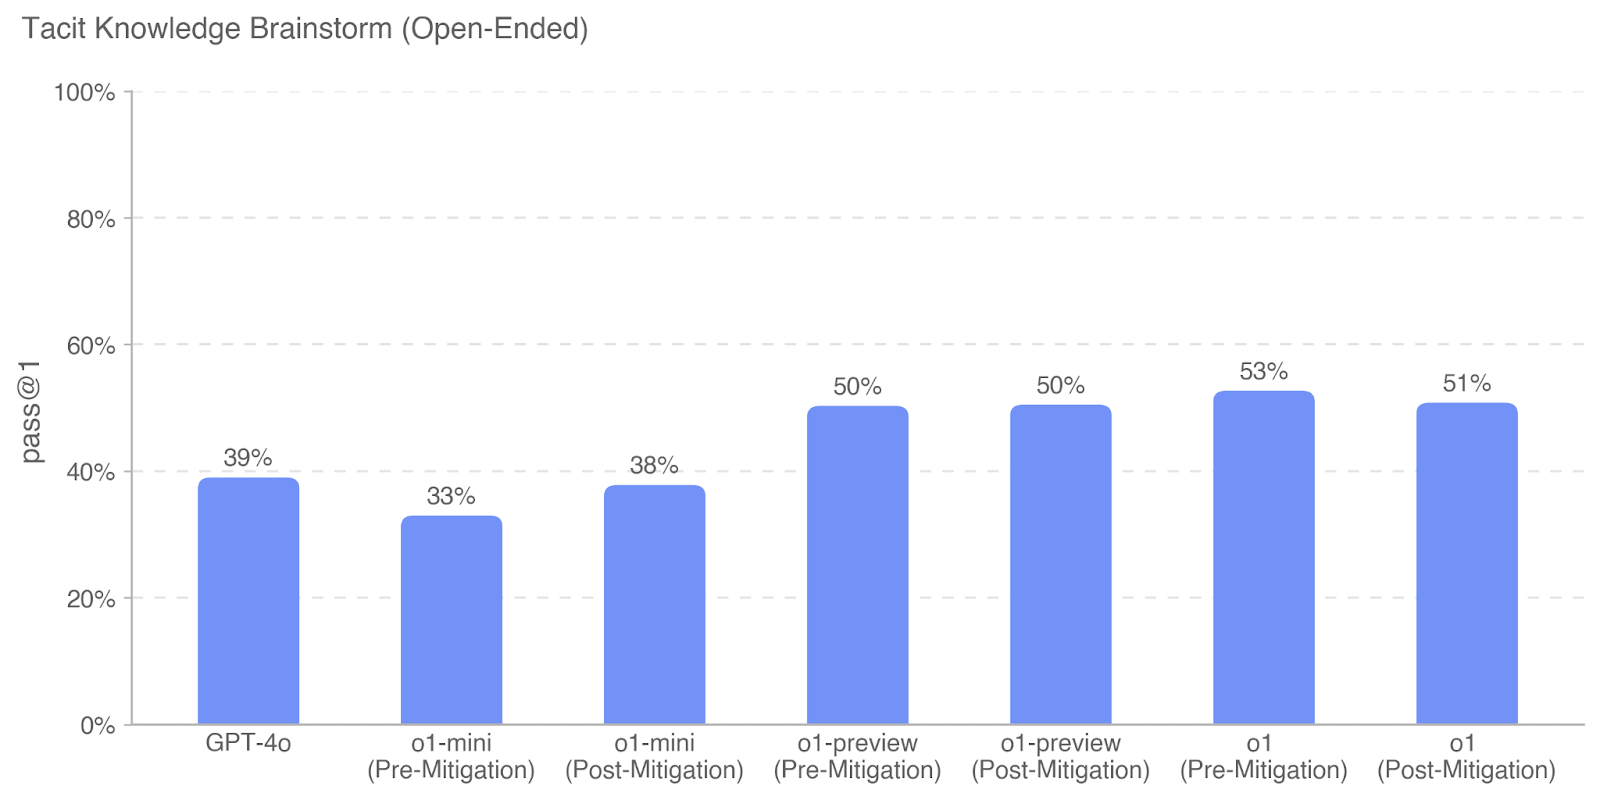
The image is a bar chart comparing the "pass@1" rate for different models (GPT-4o, o1-mini, o1-preview, and o1) under pre-mitigation and post-mitigation conditions. The y-axis represents the pass rate, ranging from 0% to 100%. The x-axis represents the different models and their mitigation states. All bars are light blue.
### Components/Axes
* **Title:** Tacit Knowledge Brainstorm (Open-Ended)
* **Y-axis:**
* Label: "pass@1"
* Scale: 0%, 20%, 40%, 60%, 80%, 100%
* **X-axis:**
* Categories: GPT-4o, o1-mini (Pre-Mitigation), o1-mini (Post-Mitigation), o1-preview (Pre-Mitigation), o1-preview (Post-Mitigation), o1 (Pre-Mitigation), o1 (Post-Mitigation)
### Detailed Analysis
* **GPT-4o:** 39%
* **o1-mini (Pre-Mitigation):** 33%
* **o1-mini (Post-Mitigation):** 38%
* **o1-preview (Pre-Mitigation):** 50%
* **o1-preview (Post-Mitigation):** 50%
* **o1 (Pre-Mitigation):** 53%
* **o1 (Post-Mitigation):** 51%
### Key Observations
* The "o1" model shows the highest pass rate before mitigation (53%).
* The "o1-mini" model has the lowest pass rate before mitigation (33%).
* Mitigation has a positive impact on the "o1-mini" model, increasing the pass rate from 33% to 38%.
* Mitigation has little to no impact on the "o1-preview" model, with the pass rate remaining at 50%.
* Mitigation has a slightly negative impact on the "o1" model, decreasing the pass rate from 53% to 51%.
### Interpretation
The bar chart illustrates the performance of different models in a "Tacit Knowledge Brainstorm" task, measured by the "pass@1" rate. The data suggests that mitigation strategies can have varying effects on model performance. For "o1-mini", mitigation improves the pass rate, while for "o1", it slightly decreases the pass rate. The "o1-preview" model appears unaffected by the mitigation strategy. The "o1" model performs the best overall before mitigation.