## Line Chart: Relationship Between Number of Layers and |⟨log Pℓ_AR⟩_data/S|
### Overview
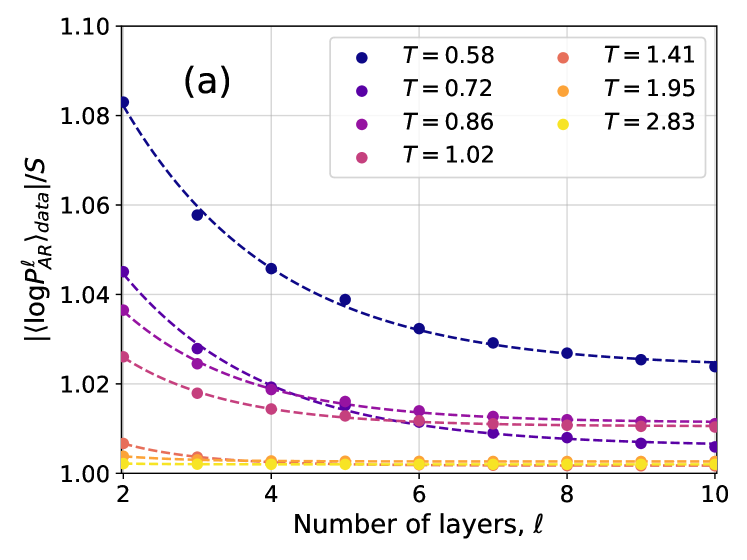
The chart illustrates how the normalized logarithmic average of a parameter (|⟨log Pℓ_AR⟩_data/S|) changes with the number of layers (ℓ) across different temperatures (T). Seven distinct temperature conditions are represented by colored lines, showing varying degrees of sensitivity to layer count.
### Components/Axes
- **X-axis**: "Number of layers, ℓ" (integer values from 2 to 10, labeled at intervals of 2).
- **Y-axis**: "|⟨log Pℓ_AR⟩_data/S|" (continuous scale from 1.00 to 1.10, with increments of 0.02).
- **Legend**: Located in the top-right corner, mapping colors to temperature values:
- Blue: T = 0.58
- Purple: T = 0.72
- Magenta: T = 0.86
- Red: T = 1.02
- Orange: T = 1.41
- Yellow: T = 1.95
- Yellow: T = 2.83 (note: two yellow entries, possibly a labeling error).
### Detailed Analysis
1. **T = 0.58 (Blue Line)**:
- Starts at ~1.08 (ℓ=2) and decreases steeply to ~1.02 (ℓ=10).
- Data points: 1.08 (ℓ=2), 1.06 (ℓ=4), 1.04 (ℓ=6), 1.03 (ℓ=8), 1.02 (ℓ=10).
2. **T = 0.72 (Purple Line)**:
- Begins at ~1.04 (ℓ=2) and declines gradually to ~1.01 (ℓ=10).
- Data points: 1.04 (ℓ=2), 1.03 (ℓ=4), 1.02 (ℓ=6), 1.01 (ℓ=8), 1.01 (ℓ=10).
3. **T = 0.86 (Magenta Line)**:
- Starts at ~1.02 (ℓ=2) and decreases slightly to ~1.01 (ℓ=10).
- Data points: 1.02 (ℓ=2), 1.015 (ℓ=4), 1.01 (ℓ=6), 1.01 (ℓ=8), 1.01 (ℓ=10).
4. **T = 1.02 (Red Line)**:
- Flat trend with minimal variation (~1.01 across all ℓ).
- Data points: ~1.01 (ℓ=2–10).
5. **T = 1.41 (Orange Line)**:
- Nearly flat, with a slight dip from ~1.005 (ℓ=2) to ~1.002 (ℓ=10).
- Data points: ~1.005 (ℓ=2), ~1.003 (ℓ=4), ~1.002 (ℓ=6–10).
6. **T = 1.95 (Yellow Line)**:
- Completely flat at ~1.00 across all ℓ.
- Data points: ~1.00 (ℓ=2–10).
7. **T = 2.83 (Yellow Line)**:
- Identical to T = 1.95, flat at ~1.00.
- Data points: ~1.00 (ℓ=2–10).
### Key Observations
- **Inverse Relationship**: All lines show a decreasing trend with increasing ℓ, but the rate of decline weakens at higher T values.
- **Saturation Effect**: For T ≥ 1.02, the parameter stabilizes near 1.00, suggesting minimal dependence on layer count.
- **Color Consistency**: Legend colors match line colors exactly (e.g., blue for T=0.58, yellow for T=1.95/2.83).
### Interpretation
The data demonstrates that higher temperatures (T) reduce the sensitivity of |⟨log Pℓ_AR⟩_data/S| to the number of layers. This implies that thermal energy may suppress layer-dependent effects, leading to a plateau in the parameter's behavior. The near-identical performance of T=1.95 and T=2.83 suggests a critical threshold (T ≈ 1.02) beyond which additional temperature increases have negligible impact. This could reflect a phase transition or equilibrium state in the system being modeled.