## Line Charts: Performance Comparison of Two Models on Different Math Benchmarks
### Overview
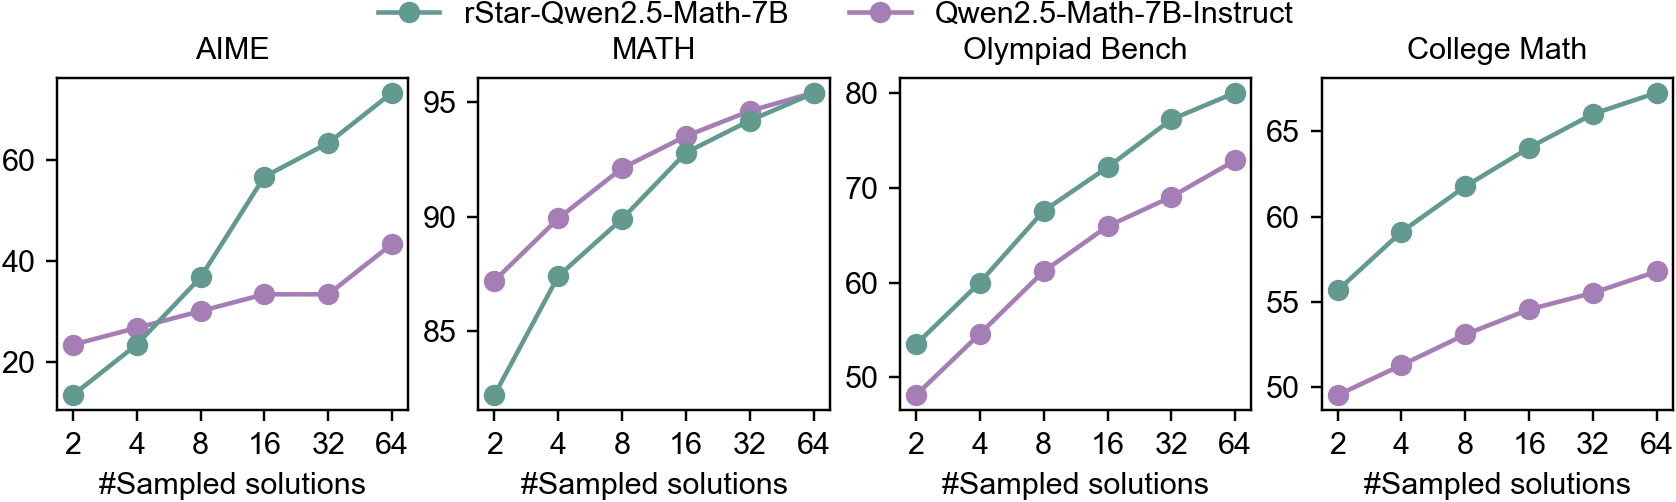
The image contains four line charts comparing the performance of two language models, "rStar-Qwen2.5-Math-7B" and "Qwen2.5-Math-7B-Instruct", on four different math benchmarks: AIME, MATH, Olympiad Bench, and College Math. The x-axis represents the number of sampled solutions, and the y-axis represents the performance score.
### Components/Axes
* **Title:** The image contains four titles, one for each chart: AIME, MATH, Olympiad Bench, and College Math.
* **X-axis:** The x-axis is labeled "#Sampled solutions" and has the following markers: 2, 4, 8, 16, 32, 64.
* **Y-axis:** The y-axis scales vary for each chart:
* AIME: 20 to 60
* MATH: 85 to 95
* Olympiad Bench: 50 to 80
* College Math: 50 to 65
* **Legend:** Located at the top of the image.
* Green: rStar-Qwen2.5-Math-7B
* Purple: Qwen2.5-Math-7B-Instruct
### Detailed Analysis
**1. AIME**
* **rStar-Qwen2.5-Math-7B (Green):** The line starts at approximately 15 and increases sharply to approximately 58 at x=8, then continues to increase to approximately 70 at x=64.
* (2, 15)
* (4, 23)
* (8, 58)
* (16, 62)
* (32, 68)
* (64, 70)
* **Qwen2.5-Math-7B-Instruct (Purple):** The line starts at approximately 22, increases to approximately 30 at x=8, then plateaus around 33.
* (2, 22)
* (4, 25)
* (8, 30)
* (16, 33)
* (32, 33)
* (64, 42)
**2. MATH**
* **rStar-Qwen2.5-Math-7B (Green):** The line starts at approximately 86 and increases to approximately 95 at x=64.
* (2, 86)
* (4, 87)
* (8, 92)
* (16, 93)
* (32, 95)
* (64, 95)
* **Qwen2.5-Math-7B-Instruct (Purple):** The line starts at approximately 88 and increases to approximately 95 at x=64.
* (2, 88)
* (4, 90)
* (8, 92)
* (16, 94)
* (32, 95)
* (64, 96)
**3. Olympiad Bench**
* **rStar-Qwen2.5-Math-7B (Green):** The line starts at approximately 50 and increases to approximately 78 at x=64.
* (2, 50)
* (4, 58)
* (8, 62)
* (16, 67)
* (32, 72)
* (64, 78)
* **Qwen2.5-Math-7B-Instruct (Purple):** The line starts at approximately 48 and increases to approximately 65 at x=64.
* (2, 48)
* (4, 52)
* (8, 57)
* (16, 60)
* (32, 63)
* (64, 65)
**4. College Math**
* **rStar-Qwen2.5-Math-7B (Green):** The line starts at approximately 55 and increases to approximately 68 at x=64.
* (2, 55)
* (4, 58)
* (8, 61)
* (16, 64)
* (32, 66)
* (64, 68)
* **Qwen2.5-Math-7B-Instruct (Purple):** The line starts at approximately 50 and increases to approximately 58 at x=64.
* (2, 50)
* (4, 52)
* (8, 54)
* (16, 56)
* (32, 57)
* (64, 58)
### Key Observations
* The performance of both models generally increases with the number of sampled solutions.
* rStar-Qwen2.5-Math-7B consistently outperforms Qwen2.5-Math-7B-Instruct on AIME, Olympiad Bench, and College Math.
* On MATH, the two models perform similarly.
* The performance increase tends to diminish as the number of sampled solutions increases, suggesting diminishing returns.
### Interpretation
The data suggests that "rStar-Qwen2.5-Math-7B" is generally a better-performing model than "Qwen2.5-Math-7B-Instruct" across the tested math benchmarks, except for the MATH benchmark where their performance is comparable. The increasing performance with more sampled solutions indicates that both models benefit from increased sampling, but the effect plateaus as the number of samples grows. This could imply that the models reach a limit in their ability to improve with more samples, or that the specific benchmarks have inherent limitations. The AIME benchmark shows a significant performance gap between the two models, suggesting that "rStar-Qwen2.5-Math-7B" is particularly well-suited for this type of problem.