## [Multi-Panel Line Chart]: Performance of Two Models on Math Benchmarks vs. Number of Sampled Solutions
### Overview
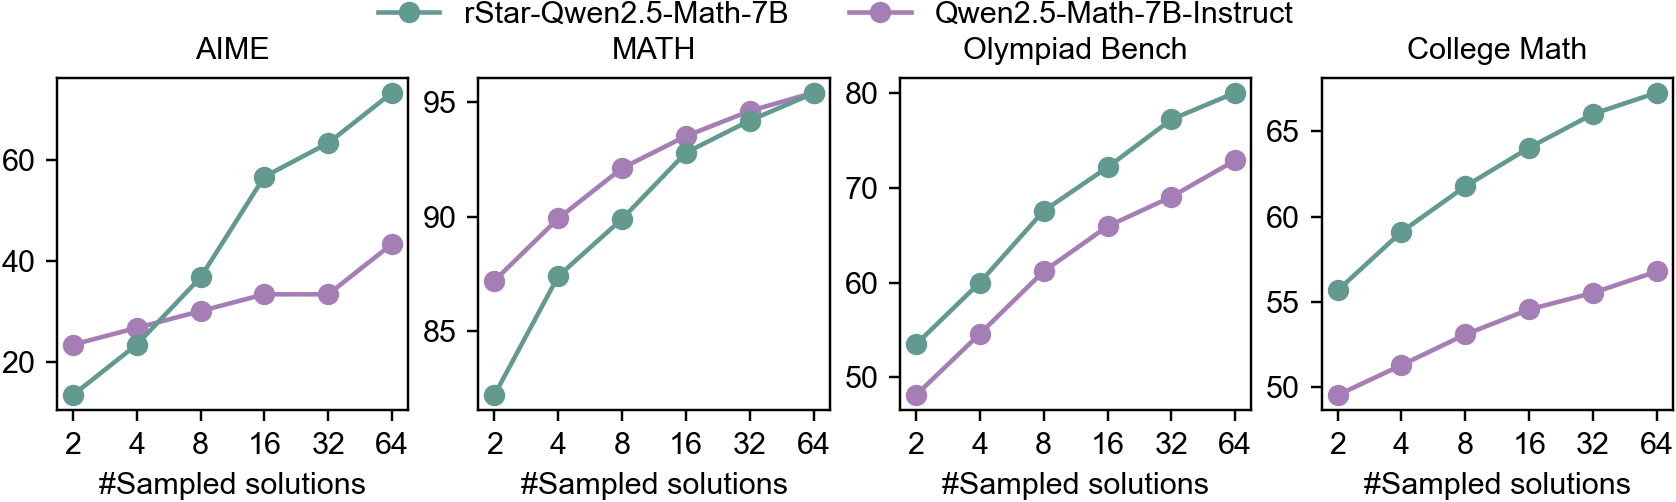
The image displays four separate line charts arranged horizontally, comparing the performance of two language models on four different mathematical benchmarks. The performance metric (y-axis) is plotted against the number of sampled solutions (x-axis). The two models are distinguished by color: a teal line for `rStar-Qwen2.5-Math-7B` and a purple line for `Qwen2.5-Math-7B-Instruct`.
### Components/Axes
* **Legend:** Located at the top center of the entire figure.
* Teal line with circle markers: `rStar-Qwen2.5-Math-7B`
* Purple line with circle markers: `Qwen2.5-Math-7B-Instruct`
* **Common X-Axis (All Charts):** Label: `#Sampled solutions`. Ticks and values: `2`, `4`, `8`, `16`, `32`, `64`.
* **Individual Chart Y-Axes:** Each chart has its own y-axis scale, representing a performance score (likely accuracy percentage).
* **AIME (Leftmost Chart):** Y-axis range approximately 10 to 70. Ticks at `20`, `40`, `60`.
* **MATH (Second from Left):** Y-axis range approximately 80 to 95. Ticks at `85`, `90`, `95`.
* **Olympiad Bench (Third from Left):** Y-axis range approximately 45 to 80. Ticks at `50`, `60`, `70`, `80`.
* **College Math (Rightmost Chart):** Y-axis range approximately 45 to 70. Ticks at `50`, `55`, `60`, `65`.
### Detailed Analysis
Data points are approximate values read from the chart positions.
**1. AIME Chart:**
* **Trend:** Both models show a strong upward trend. The `rStar` model (teal) starts lower but exhibits a much steeper slope, surpassing the `Instruct` model (purple) between 4 and 8 sampled solutions and maintaining a significant lead thereafter.
* **Data Points (Approximate):**
* `rStar-Qwen2.5-Math-7B` (Teal): (2, ~15), (4, ~23), (8, ~37), (16, ~57), (32, ~63), (64, ~68)
* `Qwen2.5-Math-7B-Instruct` (Purple): (2, ~23), (4, ~27), (8, ~30), (16, ~33), (32, ~33), (64, ~43)
**2. MATH Chart:**
* **Trend:** Both models show a consistent upward trend. The `Instruct` model (purple) starts higher, but the `rStar` model (teal) has a slightly steeper slope, nearly converging with the `Instruct` model at 64 samples.
* **Data Points (Approximate):**
* `rStar-Qwen2.5-Math-7B` (Teal): (2, ~82), (4, ~87), (8, ~90), (16, ~93), (32, ~94), (64, ~95)
* `Qwen2.5-Math-7B-Instruct` (Purple): (2, ~87), (4, ~90), (8, ~92), (16, ~93.5), (32, ~94.5), (64, ~95)
**3. Olympiad Bench Chart:**
* **Trend:** Both models show a strong, nearly parallel upward trend. The `rStar` model (teal) consistently outperforms the `Instruct` model (purple) by a margin of approximately 5-8 points across all sample sizes.
* **Data Points (Approximate):**
* `rStar-Qwen2.5-Math-7B` (Teal): (2, ~53), (4, ~60), (8, ~68), (16, ~72), (32, ~77), (64, ~80)
* `Qwen2.5-Math-7B-Instruct` (Purple): (2, ~48), (4, ~54), (8, ~61), (16, ~66), (32, ~69), (64, ~73)
**4. College Math Chart:**
* **Trend:** Both models show a steady upward trend. The `rStar` model (teal) maintains a consistent and significant lead over the `Instruct` model (purple) throughout.
* **Data Points (Approximate):**
* `rStar-Qwen2.5-Math-7B` (Teal): (2, ~56), (4, ~59), (8, ~62), (16, ~64), (32, ~66), (64, ~68)
* `Qwen2.5-Math-7B-Instruct` (Purple): (2, ~49), (4, ~51), (8, ~53), (16, ~55), (32, ~56), (64, ~57)
### Key Observations
1. **Universal Positive Correlation:** For both models and across all four benchmarks, performance improves as the number of sampled solutions increases from 2 to 64.
2. **Model Performance Gap:** The `rStar-Qwen2.5-Math-7B` model (teal) outperforms the `Qwen2.5-Math-7B-Instruct` model (purple) on three of the four benchmarks (AIME, Olympiad Bench, College Math) for most sample sizes. The gap is most pronounced in the AIME and Olympiad Bench tasks.
3. **Benchmark Difficulty:** The absolute performance levels vary significantly by benchmark. The MATH benchmark shows the highest scores (80-95), suggesting it is the "easiest" for these models. AIME shows the widest performance spread and the lowest starting scores, indicating higher difficulty.
4. **Diminishing Returns:** The rate of improvement (slope of the lines) generally decreases as the number of samples increases, particularly visible in the MATH and College Math charts for the `Instruct` model, suggesting diminishing returns from additional sampling.
### Interpretation
This data demonstrates the effectiveness of the `rStar` method (likely a form of self-refinement or reward-guided sampling) when applied to the Qwen2.5-Math-7B base model. The key finding is that `rStar` significantly boosts the model's mathematical problem-solving capabilities compared to its instruction-tuned counterpart (`Instruct`), especially on more challenging competition-style problems (AIME, Olympiad Bench).
The consistent upward trends validate the core premise of sampling multiple solutions: generating and presumably selecting from more candidate answers increases the probability of finding a correct one. The fact that `rStar`'s advantage grows with more samples in the AIME chart suggests its sampling or selection mechanism is particularly effective at leveraging increased computational budget to explore the solution space.
The variation in performance gaps across benchmarks implies that the benefits of the `rStar` approach are not uniform. It provides a massive boost on AIME (where it starts lower but ends much higher) but a more modest, consistent gain on College Math. This could indicate that `rStar` is better suited for problems requiring creative insight or multi-step reasoning (common in Olympiads) versus more procedural college-level math. The near-convergence on the MATH benchmark suggests a performance ceiling for this model size on that specific dataset, where both methods approach maximum achievable accuracy.