## Line Graphs: Performance Comparison of rStar-Qwen2.5-Math-7B and Qwen2.5-Math-7B-Instruct Across Math Benchmarks
### Overview
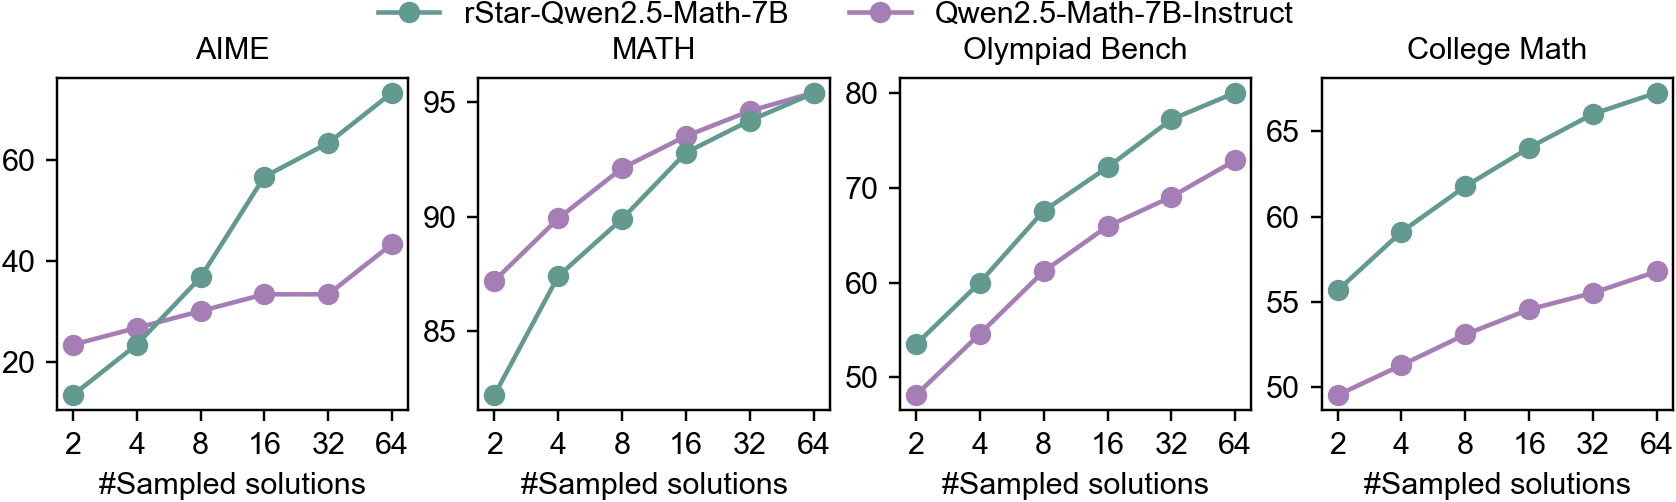
The image contains four line graphs comparing the performance of two AI models (rStar-Qwen2.5-Math-7B and Qwen2.5-Math-7B-Instruct) across four math benchmarks: AIME, MATH, Olympiad Bench, and College Math. Each graph plots performance (y-axis, %) against the number of sampled solutions (x-axis: 2, 4, 8, 16, 32, 64). The green line represents rStar-Qwen2.5-Math-7B, and the purple line represents Qwen2.5-Math-7B-Instruct.
### Components/Axes
- **X-axis**: "#Sampled solutions" (logarithmic scale: 2, 4, 8, 16, 32, 64)
- **Y-axis**: Performance (%) (ranges vary by benchmark: AIME/MATH up to 95%, Olympiad Bench up to 80%, College Math up to 65%)
- **Legends**:
- Green circle: rStar-Qwen2.5-Math-7B
- Purple circle: Qwen2.5-Math-7B-Instruct
- **Graph Titles**:
- Top-left: AIME
- Top-right: MATH
- Bottom-left: Olympiad Bench
- Bottom-right: College Math
### Detailed Analysis
#### AIME
- **rStar**: Starts at ~15% (2 samples), rises sharply to ~95% (64 samples).
- **Qwen**: Starts at ~20% (2 samples), plateaus at ~40% (64 samples).
- **Trend**: rStar outperforms Qwen by ~55 percentage points at 64 samples.
#### MATH
- **rStar**: Begins at ~15% (2 samples), climbs to ~95% (64 samples).
- **Qwen**: Starts at ~35% (2 samples), reaches ~90% (64 samples).
- **Trend**: rStar surpasses Qwen by ~5 percentage points at 64 samples.
#### Olympiad Bench
- **rStar**: Starts at ~55% (2 samples), increases to ~80% (64 samples).
- **Qwen**: Begins at ~48% (2 samples), rises to ~70% (64 samples).
- **Trend**: rStar leads by ~10 percentage points at 64 samples.
#### College Math
- **rStar**: Starts at ~55% (2 samples), grows to ~65% (64 samples).
- **Qwen**: Begins at ~48% (2 samples), reaches ~55% (64 samples).
- **Trend**: rStar maintains a ~10 percentage point advantage at 64 samples.
### Key Observations
1. **Consistent Outperformance**: rStar-Qwen2.5-Math-7B consistently outperforms Qwen2.5-Math-7B-Instruct across all benchmarks, with the largest gap in AIME (~55%) and MATH (~5%).
2. **Scaling Effect**: Performance improves for both models as sampled solutions increase, but rStar’s gains are steeper (e.g., AIME: +80% improvement vs. Qwen’s +20%).
3. **Diminishing Returns**: Qwen’s performance plateaus earlier (e.g., AIME at 40% vs. rStar’s 95% at 64 samples).
4. **Benchmark-Specific Gaps**: Olympiad Bench and College Math show smaller performance differences (~10%) compared to AIME/MATH.
### Interpretation
The data suggests that rStar-Qwen2.5-Math-7B demonstrates superior problem-solving capabilities across diverse math benchmarks, particularly in high-complexity tasks like AIME and MATH. The performance gap widens with increased sampling, indicating that rStar’s architecture or training may better leverage additional computational resources. Qwen2.5-Math-7B-Instruct shows diminishing returns at higher sampling rates, suggesting potential limitations in its solution-generation strategy. The smaller gaps in Olympiad and College Math may reflect overlapping problem domains where both models achieve higher baseline accuracy. These results highlight the importance of model architecture design in scaling mathematical reasoning tasks.