## Bar Chart: Performance Speedup vs. Threshold
### Overview
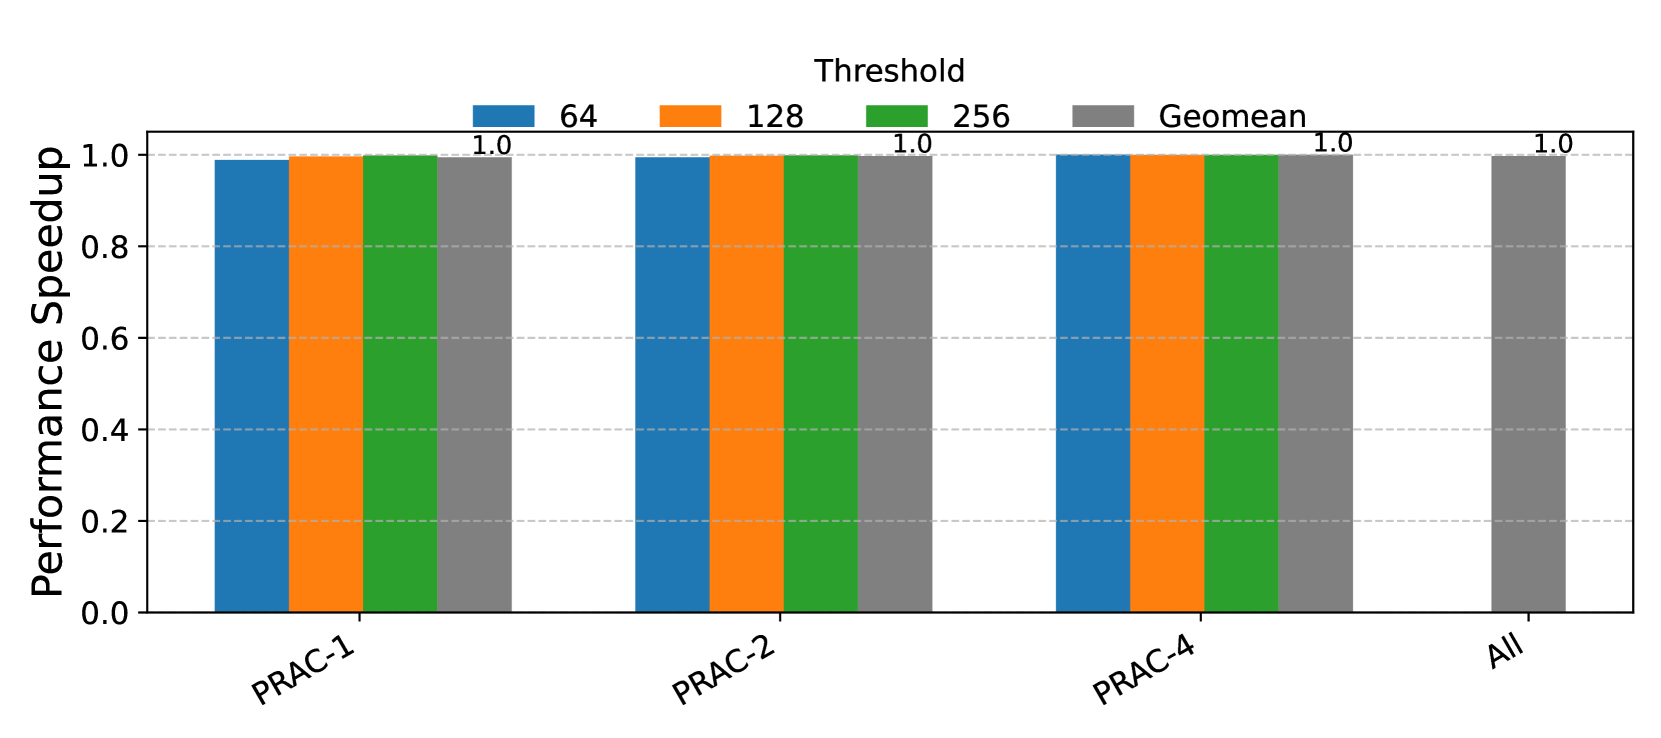
The image is a bar chart comparing the performance speedup for different configurations (PRAC-1, PRAC-2, PRAC-4, and All) under varying threshold values (64, 128, and 256) and their geometric mean (Geomean). The y-axis represents the performance speedup, and the x-axis represents the configurations. All configurations and thresholds show a performance speedup of 1.0.
### Components/Axes
* **Title:** Threshold
* **Y-axis:** Performance Speedup, with a scale from 0.0 to 1.0 in increments of 0.2.
* **X-axis:** Configurations: PRAC-1, PRAC-2, PRAC-4, All.
* **Legend:** Located at the top of the chart.
* Blue: 64
* Orange: 128
* Green: 256
* Gray: Geomean
### Detailed Analysis
* **PRAC-1:**
* Threshold 64 (Blue): 1.0
* Threshold 128 (Orange): 1.0
* Threshold 256 (Green): 1.0
* Geomean (Gray): 1.0
* **PRAC-2:**
* Threshold 64 (Blue): 1.0
* Threshold 128 (Orange): 1.0
* Threshold 256 (Green): 1.0
* Geomean (Gray): 1.0
* **PRAC-4:**
* Threshold 64 (Blue): 1.0
* Threshold 128 (Orange): 1.0
* Threshold 256 (Green): 1.0
* Geomean (Gray): 1.0
* **All:**
* Geomean (Gray): 1.0
### Key Observations
* All configurations (PRAC-1, PRAC-2, PRAC-4, and All) achieve a performance speedup of 1.0 for all threshold values (64, 128, and 256) and their geometric mean.
* There is no variation in performance speedup across different configurations or threshold values.
### Interpretation
The data suggests that the performance speedup is consistently optimal (1.0) regardless of the configuration (PRAC-1, PRAC-2, PRAC-4, All) or the threshold value (64, 128, 256). This could indicate that the system is performing at its maximum potential under these conditions, or that the performance metric is not sensitive enough to capture any differences between the configurations or thresholds.