# Technical Document Analysis: Performance Speedup Chart
## Chart Overview
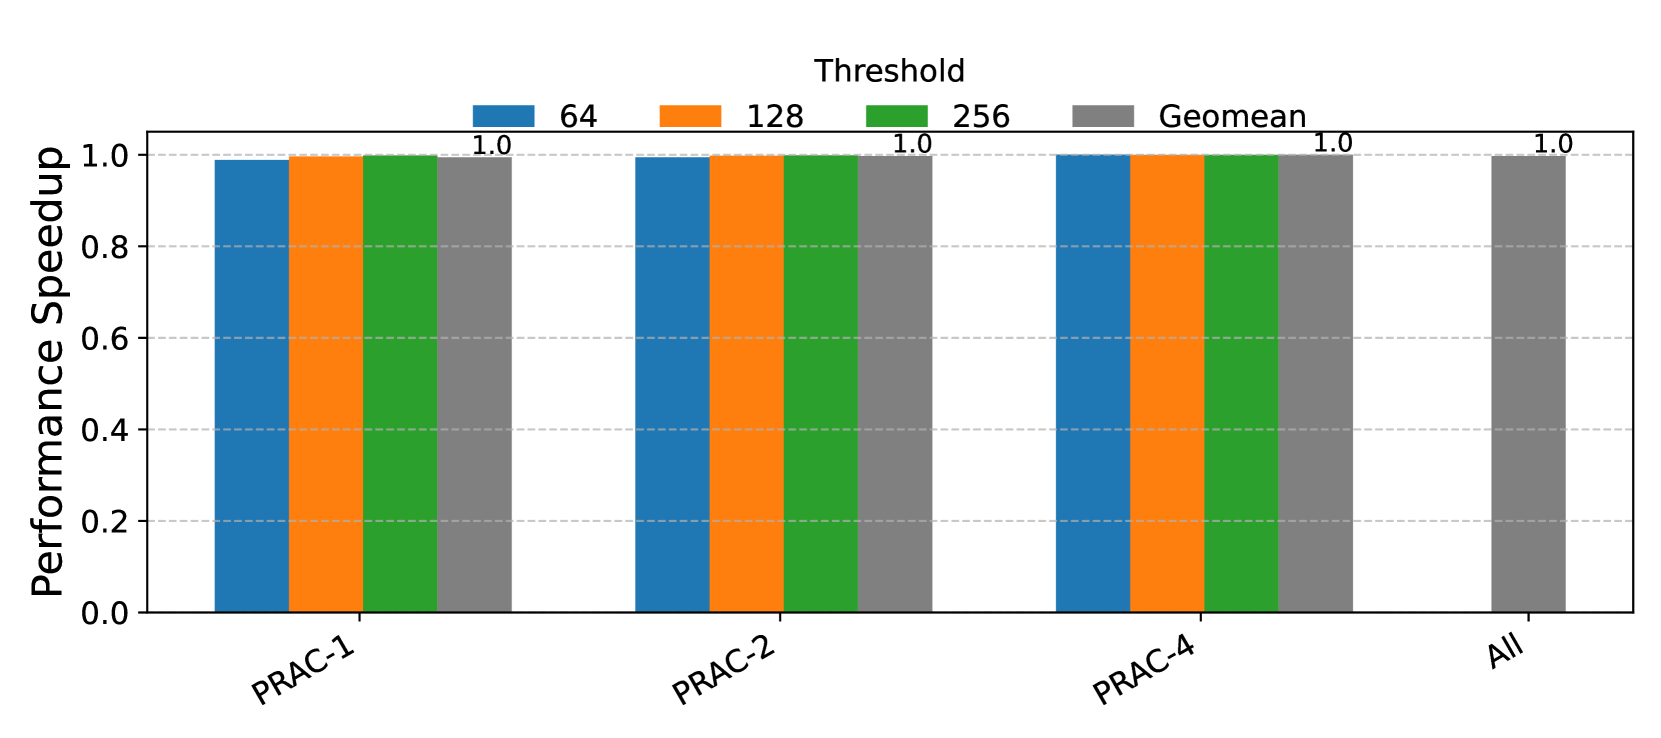
The image is a **grouped bar chart** titled **"Performance Speedup"**. It compares performance metrics across different computational thresholds (64, 128, 256) and a geometric mean (Geomean) across four categories: **PRAC-1**, **PRAC-2**, **PRAC-4**, and **All**.
---
## Axes and Labels
- **X-Axis**:
Categories: `PRAC-1`, `PRAC-2`, `PRAC-4`, `All`
Labels are evenly spaced and centered under each group of bars.
- **Y-Axis**:
Title: `Performance Speedup`
Scale: `0.0` to `1.0` in increments of `0.2`
Dotted gridlines at `0.2`, `0.4`, `0.6`, `0.8`, `1.0`.
- **Legend**:
Position: Top of the chart
Colors and Labels:
- `64` (blue)
- `128` (orange)
- `256` (green)
- `Geomean` (gray)
---
## Data Points and Trends
### Key Observations:
1. **All Bars Reach Maximum Value**:
- Every bar (for all thresholds and categories) reaches `1.0` on the y-axis.
- This indicates **100% performance speedup** across all configurations.
2. **Geomean Consistency**:
- The `Geomean` (gray) bar matches the value of `1.0` for all categories, confirming it is the geometric mean of the thresholds (64, 128, 256).
3. **Uniform Performance**:
- No variation exists between thresholds (`64`, `128`, `256`) or categories (`PRAC-1`, `PRAC-2`, `PRAC-4`, `All`).
- All bars are **flat at 1.0**, showing no upward or downward trend.
---
## Spatial Grounding and Color Verification
- **Legend Colors**:
- `64` (blue) matches the leftmost bar in each group.
- `128` (orange) matches the second bar.
- `256` (green) matches the third bar.
- `Geomean` (gray) matches the rightmost bar in each group.
- **Spatial Placement**:
- Legend is positioned at the **top** of the chart, above the x-axis labels.
- Bars are grouped vertically under each x-axis category.
---
## Component Isolation
### Header:
- Title: `Performance Speedup`
- Legend: Thresholds (`64`, `128`, `256`) and `Geomean`.
### Main Chart:
- **X-Axis Categories**:
- `PRAC-1`: All bars at `1.0`.
- `PRAC-2`: All bars at `1.0`.
- `PRAC-4`: All bars at `1.0`.
- `All`: Single gray bar (Geomean) at `1.0`.
### Footer:
- No additional text or annotations.
---
## Data Table Reconstruction
| Category | 64 | 128 | 256 | Geomean |
|------------|------|------|------|---------|
| PRAC-1 | 1.0 | 1.0 | 1.0 | 1.0 |
| PRAC-2 | 1.0 | 1.0 | 1.0 | 1.0 |
| PRAC-4 | 1.0 | 1.0 | 1.0 | 1.0 |
| All | - | - | - | 1.0 |
---
## Conclusion
The chart demonstrates **uniform performance speedup** across all tested thresholds and categories, with no discernible variation. The geometric mean (`Geomean`) aligns perfectly with the individual thresholds, reinforcing the consistency of the results. All data points are explicitly labeled as `1.0`, indicating optimal performance.