## Bar Chart: Proportion of Preference Comparison
### Overview
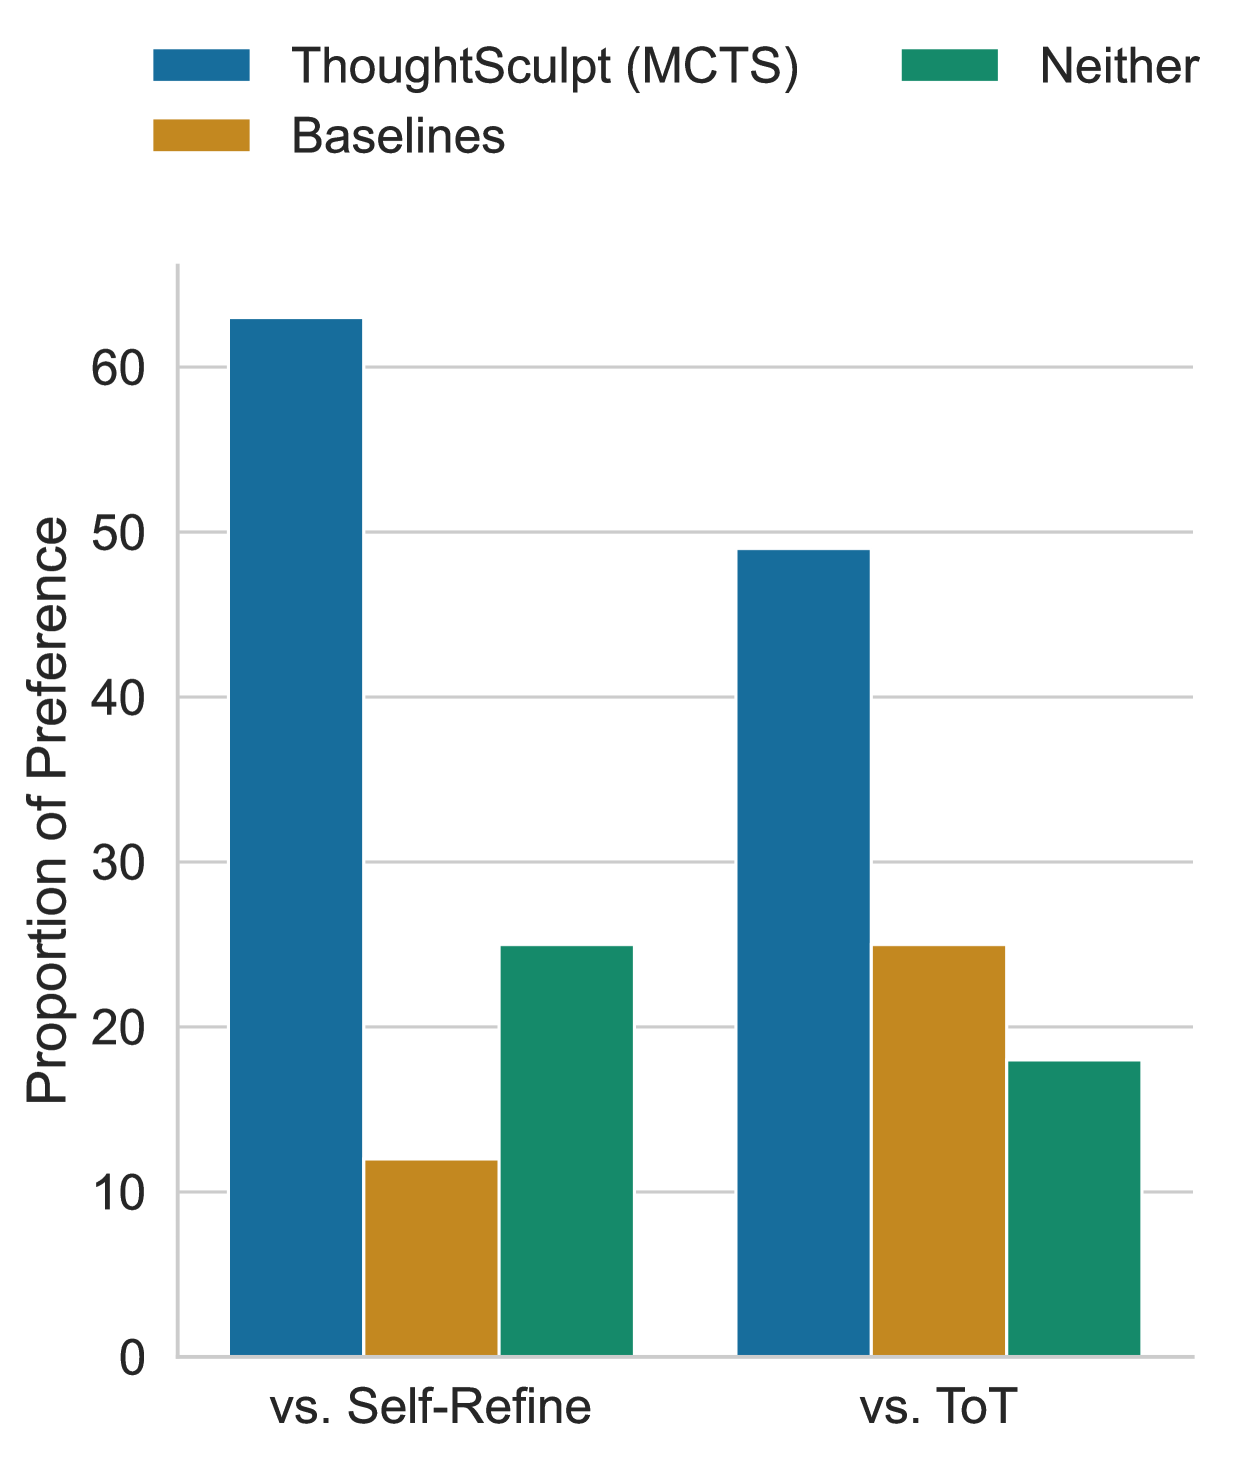
This image is a bar chart comparing the proportion of preference for different methods across two scenarios: "vs. Self-Refine" and "vs. ToT". The chart displays three categories of preference: "ThoughtSculpt (MCTS)", "Baselines", and "Neither".
### Components/Axes
* **Title**: The chart does not have an explicit title, but the y-axis label and the x-axis labels provide context.
* **Y-axis Label**: "Proportion of Preference"
* **Y-axis Scale**: The y-axis ranges from 0 to 60, with major tick marks at 0, 10, 20, 30, 40, 50, and 60.
* **X-axis Labels**: The x-axis has two main categories: "vs. Self-Refine" and "vs. ToT".
* **Legend**: Located at the top-left of the chart.
* **Blue Rectangle**: "ThoughtSculpt (MCTS)"
* **Orange Rectangle**: "Baselines"
* **Green Rectangle**: "Neither"
### Detailed Analysis
The chart presents grouped bar data for two distinct comparison scenarios.
**Scenario 1: vs. Self-Refine**
* **ThoughtSculpt (MCTS)** (Blue bar): This bar rises to approximately 62% on the y-axis.
* **Baselines** (Orange bar): This bar rises to approximately 12% on the y-axis.
* **Neither** (Green bar): This bar rises to approximately 25% on the y-axis.
**Scenario 2: vs. ToT**
* **ThoughtSculpt (MCTS)** (Blue bar): This bar rises to approximately 48% on the y-axis.
* **Baselines** (Orange bar): This bar rises to approximately 25% on the y-axis.
* **Neither** (Green bar): This bar rises to approximately 18% on the y-axis.
### Key Observations
* In the "vs. Self-Refine" scenario, "ThoughtSculpt (MCTS)" shows a significantly higher proportion of preference (approx. 62%) compared to "Baselines" (approx. 12%) and "Neither" (approx. 25%).
* In the "vs. ToT" scenario, "ThoughtSculpt (MCTS)" still has the highest proportion of preference (approx. 48%), but the gap between it and the other categories is smaller.
* The "Baselines" category shows an increase in preference from "vs. Self-Refine" (approx. 12%) to "vs. ToT" (approx. 25%).
* The "Neither" category shows a decrease in preference from "vs. Self-Refine" (approx. 25%) to "vs. ToT" (approx. 18%).
* The sum of proportions for each scenario is approximately 100% (62 + 12 + 25 = 99% for vs. Self-Refine; 48 + 25 + 18 = 91% for vs. ToT). There might be rounding or missing data for the "vs. ToT" scenario to sum to exactly 100%.
### Interpretation
This bar chart demonstrates the relative preference for "ThoughtSculpt (MCTS)" compared to "Baselines" and a "Neither" option across two different comparative contexts.
The data suggests that "ThoughtSculpt (MCTS)" is generally preferred over "Baselines" and the "Neither" option, particularly in the "vs. Self-Refine" scenario where it achieves over 60% preference. This indicates a strong performance or appeal of "ThoughtSculpt (MCTS)" when compared against a self-refinement baseline.
In the "vs. ToT" scenario, while "ThoughtSculpt (MCTS)" remains the most preferred option, its dominance is reduced. The increase in preference for "Baselines" and the decrease for "Neither" in this scenario suggest a shift in how users perceive or interact with the options when compared against the "ToT" baseline. It's possible that the "ToT" baseline is more competitive or that the "Neither" option becomes less appealing in this context.
The observed trends could imply that "ThoughtSculpt (MCTS)" is a robust method, but its advantage might be context-dependent. The changes in preference for "Baselines" and "Neither" between the two scenarios warrant further investigation into the specific characteristics of "Self-Refine" and "ToT" that influence user choices. The slight discrepancy in the sum of proportions for the "vs. ToT" scenario might be due to rounding in the data presentation or a small unrepresented category.