## Fault Tree Diagram: Boolean Logic Tree
### Overview
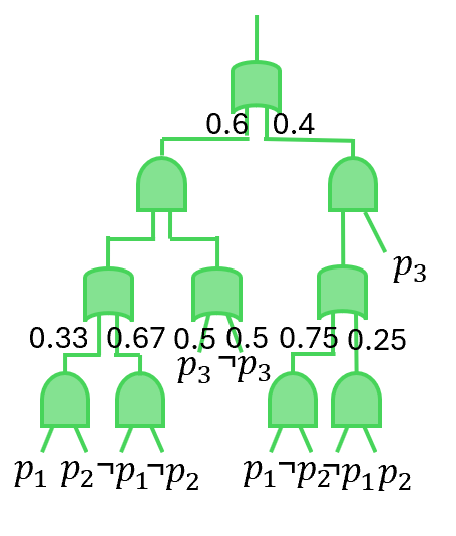
The image presents a fault tree diagram, a top-down, deductive failure analysis used to determine how system failures can occur. The diagram uses logic gates (AND, OR) to represent the relationships between events leading to a top-level fault. The diagram is rendered in light green, with probabilities associated with certain branches.
### Components/Axes
* **Logic Gates:** The diagram uses rounded-corner rectangles to represent logic gates.
* **Events:** Events are represented by the inputs to the logic gates, labeled with propositional variables (p1, p2, p3) or combinations thereof.
* **Probabilities:** Numerical values (e.g., 0.6, 0.4, 0.33) are associated with branches, representing probabilities of events occurring.
* **Labels:** The labels include propositional variables (p1, p2, p3) and their negations (¬p1, ¬p2, ¬p3).
### Detailed Analysis
The diagram can be broken down into levels, starting from the top:
* **Top Level:** A single OR gate at the top.
* The output of the top OR gate is connected to two inputs with probabilities 0.6 and 0.4.
* **Second Level:** The left input of the top OR gate is connected to an AND gate. The right input of the top OR gate is connected to an OR gate with an additional input.
* The right input of the top OR gate has an additional input labeled "p3".
* **Third Level:** The left AND gate is connected to two OR gates. The right OR gate is connected to a single AND gate.
* The left OR gate has probabilities 0.33 and 0.67.
* The right OR gate has probabilities 0.75 and 0.25.
* The left AND gate has probabilities 0.5 and 0.5, with labels "p3" and "¬p3".
* **Bottom Level:** The bottom level consists of inputs to the OR and AND gates, labeled with propositional variables and their negations.
* The left OR gate has inputs "p1" and "p2".
* The right OR gate has inputs "¬p1" and "¬p2".
* The left OR gate has inputs "p1" and "¬p2".
* The right OR gate has inputs "¬p1" and "p2".
The probabilities are associated with the branches leading into the logic gates. For example, the top OR gate has inputs with probabilities 0.6 and 0.4. The sum of these probabilities is 1.0.
### Key Observations
* The diagram represents a fault tree, showing how different events can lead to a top-level failure.
* The probabilities associated with the branches indicate the likelihood of each event occurring.
* The logic gates (AND, OR) define the relationships between the events.
* The propositional variables (p1, p2, p3) represent the basic events in the system.
### Interpretation
The fault tree diagram provides a visual representation of the potential causes of a system failure. By analyzing the diagram, it is possible to identify the most critical events and the most likely paths to failure. The probabilities associated with the branches allow for a quantitative assessment of the risk associated with each event. The diagram can be used to improve system design, identify potential weaknesses, and develop mitigation strategies to reduce the likelihood of failure. The presence of both p3 and ¬p3 suggests that the system's behavior depends on both the occurrence and non-occurrence of event p3. The diagram highlights the importance of considering both individual component failures and the interactions between components when assessing system reliability.