## Probability Tree Diagram: Hierarchical Probability Distribution
### Overview
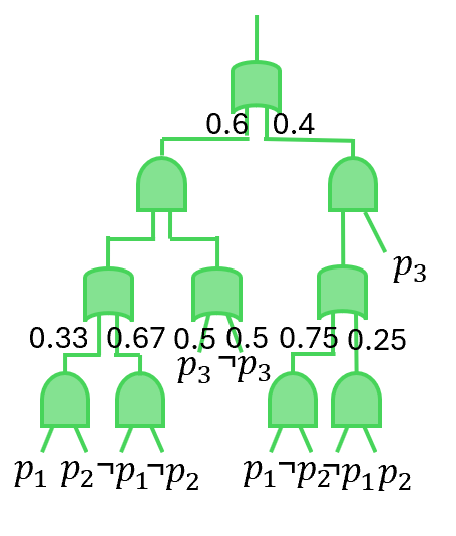
The image depicts a hierarchical probability tree diagram with green nodes and branches. The structure represents sequential probabilistic decisions or outcomes, with numerical probabilities assigned to each branch. The diagram includes labeled nodes (p1, p2, p3) and branching probabilities, suggesting a decision tree or stochastic process.
### Components/Axes
- **Nodes**: Green circular and rectangular shapes representing decision points or outcomes.
- **Branches**: Green lines connecting nodes, annotated with probabilities (e.g., 0.6, 0.4, 0.33, 0.67, etc.).
- **Labels**:
- **p1, p2, p3**: Node labels at the bottom level, indicating final outcomes or states.
- **p1-p2, p1-p2-p1-p2**: Composite labels on the rightmost branches, suggesting sequential dependencies.
- **Probabilities**: Numerical values (e.g., 0.6, 0.4, 0.33, 0.67, 0.5, 0.5, 0.75, 0.25) assigned to branches, representing transition probabilities between nodes.
### Detailed Analysis
- **Top Node**:
- Branches split into two paths with probabilities **0.6** (left) and **0.4** (right).
- **Second Level Nodes**:
- Left branch (0.6) splits into **0.33** (left) and **0.67** (right).
- Right branch (0.4) splits into **0.5** (left) and **0.5** (right).
- **Third Level Nodes**:
- Leftmost branch (0.33) splits into **p1** (left) and **p2** (right).
- Middle branch (0.67) splits into **p1-p2** (left) and **p1-p2-p1-p2** (right).
- Rightmost branch (0.5) splits into **p1-p2** (left) and **p1-p2-p1-p2** (right).
- Final right branch (0.25) splits into **p1-p2-p1-p2** (left) and **p1-p2-p1-p2** (right).
### Key Observations
- The tree is **binary** at each level, with probabilities summing to 1 at each node (e.g., 0.6 + 0.4 = 1, 0.33 + 0.67 = 1).
- The rightmost branches consistently include composite labels (e.g., p1-p2-p1-p2), suggesting recursive or dependent outcomes.
- The probabilities decrease as the tree progresses (e.g., 0.6 → 0.33 → p1), indicating diminishing likelihoods for certain paths.
### Interpretation
This diagram likely represents a **stochastic process** or **decision tree** where each node corresponds to a decision or event, and branches represent possible outcomes with associated probabilities. The labels (p1, p2, p3) may denote distinct states or actions, while the composite labels (e.g., p1-p2-p1-p2) imply sequences of events. The structure suggests a **Markov process** or **Bayesian network**, where the probability of each path depends on prior decisions.
Notably, the rightmost branches (e.g., p1-p2-p1-p2) have lower probabilities (0.25), indicating less likely sequences. The use of green for all nodes and branches implies a unified system, though no explicit legend is present. The diagram emphasizes **conditional probabilities**, as each branch’s value depends on the preceding node’s probability.
This visualization could be used in fields like **machine learning** (e.g., decision trees), **statistics** (e.g., probability distributions), or **operations research** (e.g., risk analysis). The hierarchical structure allows for modeling complex dependencies between events.