## Line Chart: Throughput vs. Batch Size
### Overview
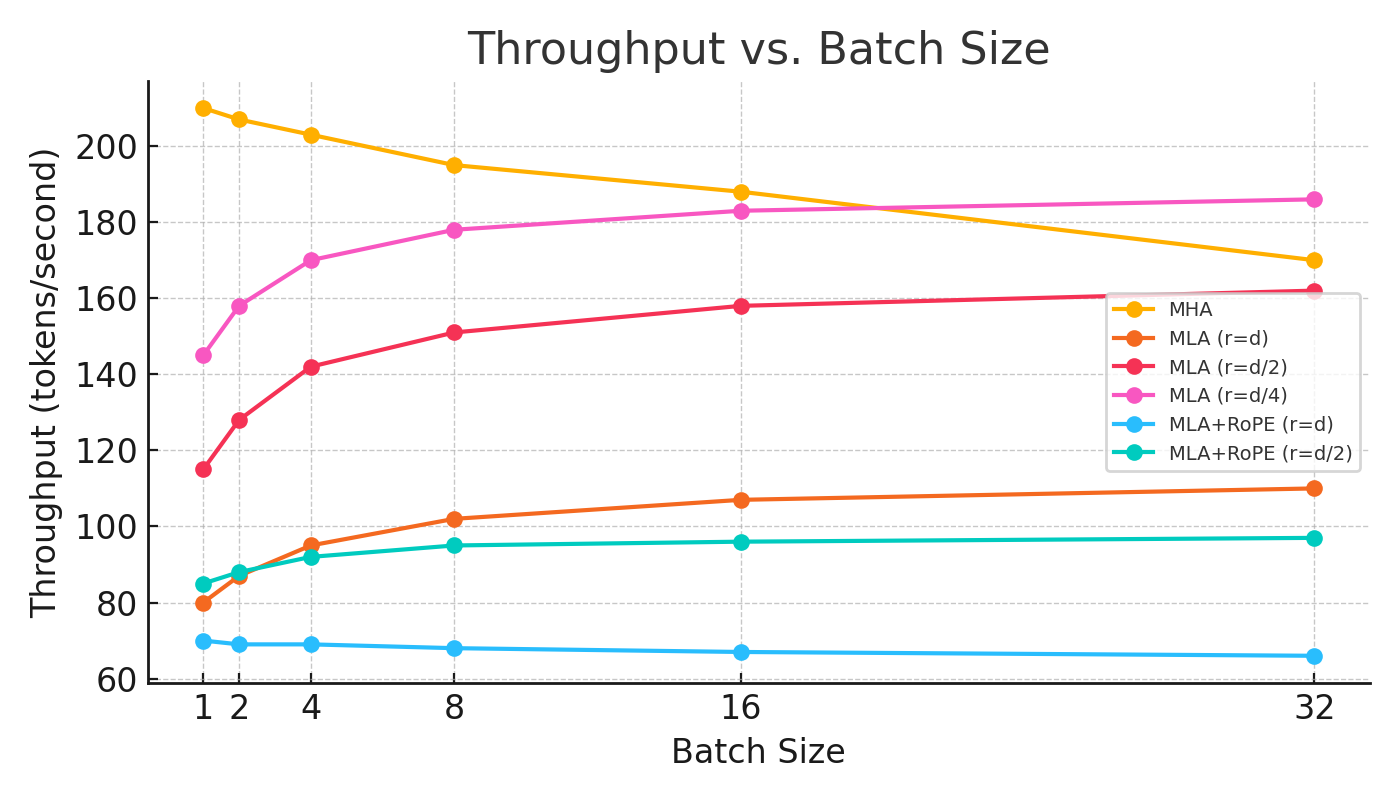
This chart illustrates the performance, measured in throughput (tokens/second), of various attention mechanisms across a range of batch sizes (1, 2, 4, 8, 16, 32). The chart compares standard Multi-Head Attention (MHA) against Multi-Head Latent Attention (MLA) variants, including those with Rotary Positional Embeddings (RoPE).
### Components/Axes
* **Title:** "Throughput vs. Batch Size"
* **X-Axis:** "Batch Size" (Non-linear scale: 1, 2, 4, 8, 16, 32).
* **Y-Axis:** "Throughput (tokens/second)" (Linear scale: 60, 80, 100, 120, 140, 160, 180, 200).
* **Legend (Positioned center-right):**
* **Yellow:** MHA
* **Orange:** MLA (r=d)
* **Red:** MLA (r=d/2)
* **Pink:** MLA (r=d/4)
* **Light Blue:** MLA+RoPE (r=d)
* **Teal:** MLA+RoPE (r=d/2)
### Detailed Analysis
The following data points are approximate based on visual inspection of the chart:
| Batch Size | MHA (Yellow) | MLA (r=d/4) (Pink) | MLA (r=d/2) (Red) | MLA (r=d) (Orange) | MLA+RoPE (r=d/2) (Teal) | MLA+RoPE (r=d) (Light Blue) |
| :--- | :--- | :--- | :--- | :--- | :--- | :--- |
| **1** | ~210 | ~145 | ~115 | ~80 | ~85 | ~70 |
| **2** | ~208 | ~158 | ~128 | ~87 | ~88 | ~69 |
| **4** | ~203 | ~170 | ~142 | ~96 | ~92 | ~69 |
| **8** | ~195 | ~178 | ~151 | ~102 | ~95 | ~68 |
| **16** | ~188 | ~183 | ~158 | ~107 | ~96 | ~67 |
| **32** | ~170 | ~186 | ~162 | ~110 | ~97 | ~66 |
**Trend Verification:**
* **MHA (Yellow):** Slopes downward consistently as batch size increases.
* **MLA (Pink, Red, Orange):** All three variants slope upward, showing increased throughput as batch size increases, with the rate of increase slowing down (logarithmic-like growth).
* **MLA+RoPE (Teal):** Slopes upward, but flattens significantly after batch size 8.
* **MLA+RoPE (Light Blue):** Shows a very slight, consistent downward trend.
### Key Observations
* **MHA Performance:** MHA starts as the highest-performing mechanism at batch size 1 (~210 tokens/s) but is the only series that degrades as batch size increases, eventually being overtaken by MLA (r=d/4) at batch size 32.
* **Rank Impact:** Within the MLA family, lower rank values (r=d/4) consistently yield higher throughput than higher rank values (r=d).
* **RoPE Overhead:** The addition of RoPE (Rotary Positional Embeddings) significantly reduces throughput compared to the base MLA variants. For example, MLA (r=d/2) (Red) performs significantly better than MLA+RoPE (r=d/2) (Teal).
* **Scaling:** The MLA variants (without RoPE) demonstrate strong scaling characteristics, where throughput improves as batch size increases, suggesting they are better optimized for larger batch workloads than MHA.
### Interpretation
The data suggests a trade-off between architectural complexity and throughput scaling.
1. **MHA Limitations:** The downward trend of MHA suggests that while it is highly efficient for single-token or very small batch inference, it likely encounters memory bandwidth or compute bottlenecks as the batch size grows, causing throughput to drop.
2. **MLA Efficiency:** The MLA architecture appears designed to handle larger batch sizes more effectively. The inverse relationship between the rank ($r$) and throughput indicates that compressing the attention mechanism (lower $r$) provides substantial performance gains.
3. **RoPE Penalty:** The inclusion of RoPE introduces a performance penalty. The fact that MLA+RoPE (r=d) (Light Blue) is the lowest performing line suggests that the combination of higher rank and RoPE creates a significant computational overhead that does not scale well with batch size.
4. **Optimal Use Cases:** If the goal is high-throughput batch processing, MLA (r=d/4) is the superior choice among those tested. If the goal is low-latency, single-batch inference, standard MHA remains the most performant option.