## Line Chart: Throughput vs. Batch Size
### Overview
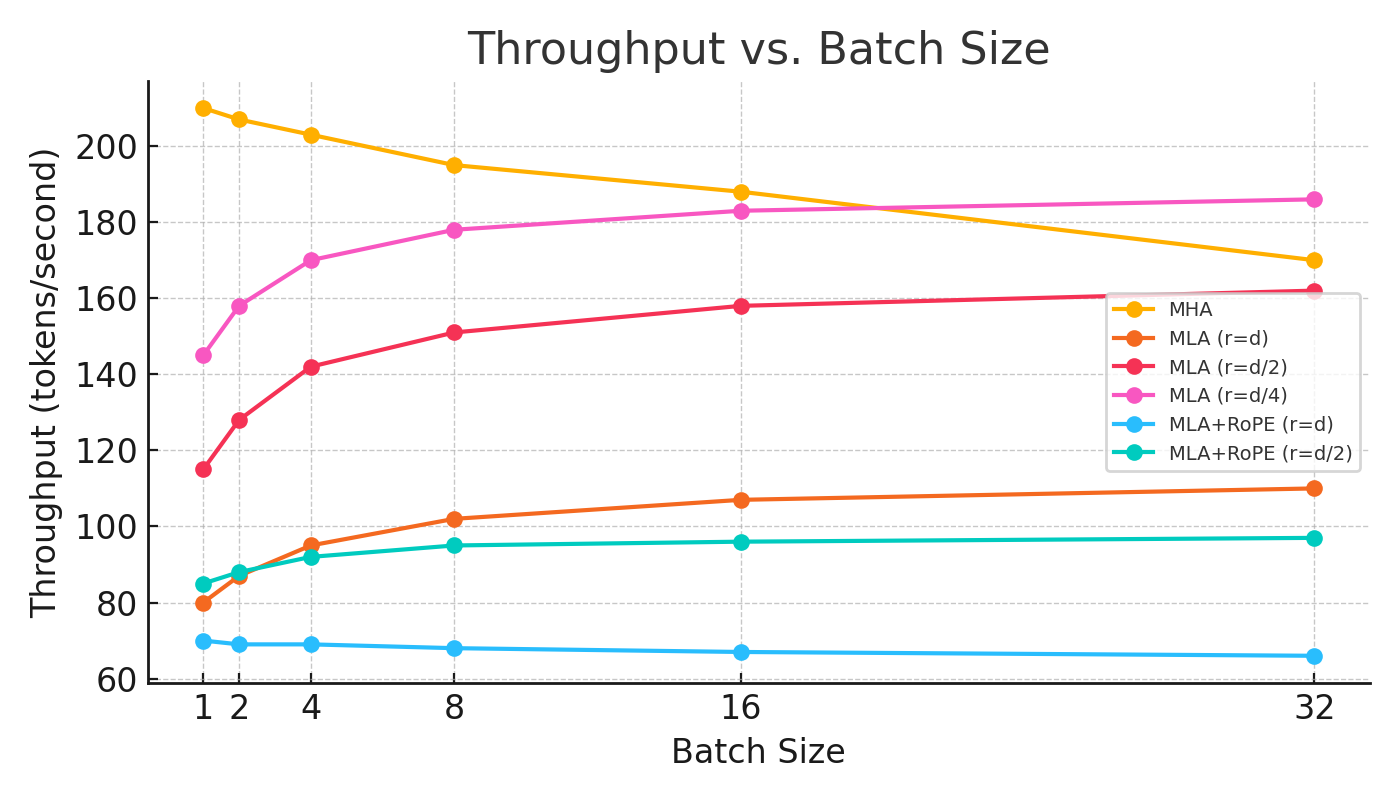
The chart compares the throughput (tokens/second) of different transformer model architectures (MHA, MLA, MLA+RoPE) across varying batch sizes (1 to 32). Five data series are plotted, each representing a unique configuration of attention mechanisms and positional encoding (RoPE). Throughput trends are analyzed against batch size increments.
### Components/Axes
- **X-axis (Batch Size)**: Logarithmic scale with values [1, 2, 4, 8, 16, 32].
- **Y-axis (Throughput)**: Linear scale from 60 to 220 tokens/second.
- **Legend**:
- Orange: MHA (r=d)
- Red: MLA (r=d)
- Magenta: MLA (r=d/4)
- Blue: MLA+RoPE (r=d)
- Cyan: MLA+RoPE (r=d/2)
### Detailed Analysis
1. **MHA (Orange Line)**:
- Starts at ~210 tokens/second (batch size 1).
- Decreases steadily to ~170 tokens/second (batch size 32).
- Trend: Linear decline with increasing batch size.
2. **MLA (r=d) (Red Line)**:
- Begins at ~115 tokens/second (batch size 1).
- Increases to ~165 tokens/second (batch size 32).
- Trend: Steady upward slope.
3. **MLA (r=d/4) (Magenta Line)**:
- Starts at ~145 tokens/second (batch size 1).
- Rises to ~185 tokens/second (batch size 32).
- Trend: Consistent growth, outperforming MHA at larger batches.
4. **MLA+RoPE (r=d) (Blue Line)**:
- Begins at ~70 tokens/second (batch size 1).
- Drops slightly to ~65 tokens/second (batch size 32).
- Trend: Minimal decline, stable performance.
5. **MLA+RoPE (r=d/2) (Cyan Line)**:
- Starts at ~85 tokens/second (batch size 1).
- Increases to ~95 tokens/second (batch size 32).
- Trend: Gradual improvement with batch size.
### Key Observations
- **MHA Underperformance**: MHA throughput degrades significantly with larger batches, suggesting inefficiency in parallelization.
- **MLA Scaling**: MLA variants (especially r=d/4) show superior scalability, with throughput increasing as batch size grows.
- **RoPE Impact**: MLA+RoPE (r=d/2) achieves the highest throughput among RoPE-enhanced models, indicating positional encoding benefits smaller r values.
- **Batch Size Thresholds**: All models exhibit plateauing or diminishing returns beyond batch size 16.
### Interpretation
The data highlights trade-offs between model architecture and batch size efficiency. MHA’s decline suggests it is less optimized for large-scale parallel processing compared to MLA variants. MLA with reduced r values (e.g., r=d/4) scales effectively, likely due to architectural optimizations. The inclusion of RoPE in MLA+RoPE models improves performance, particularly at r=d/2, where positional encoding enhances throughput without excessive computational overhead. These trends imply that MLA-based models with adaptive r values and RoPE are more suitable for high-throughput applications with large batch sizes.