## Diagram: Flowchart of Processes
### Overview
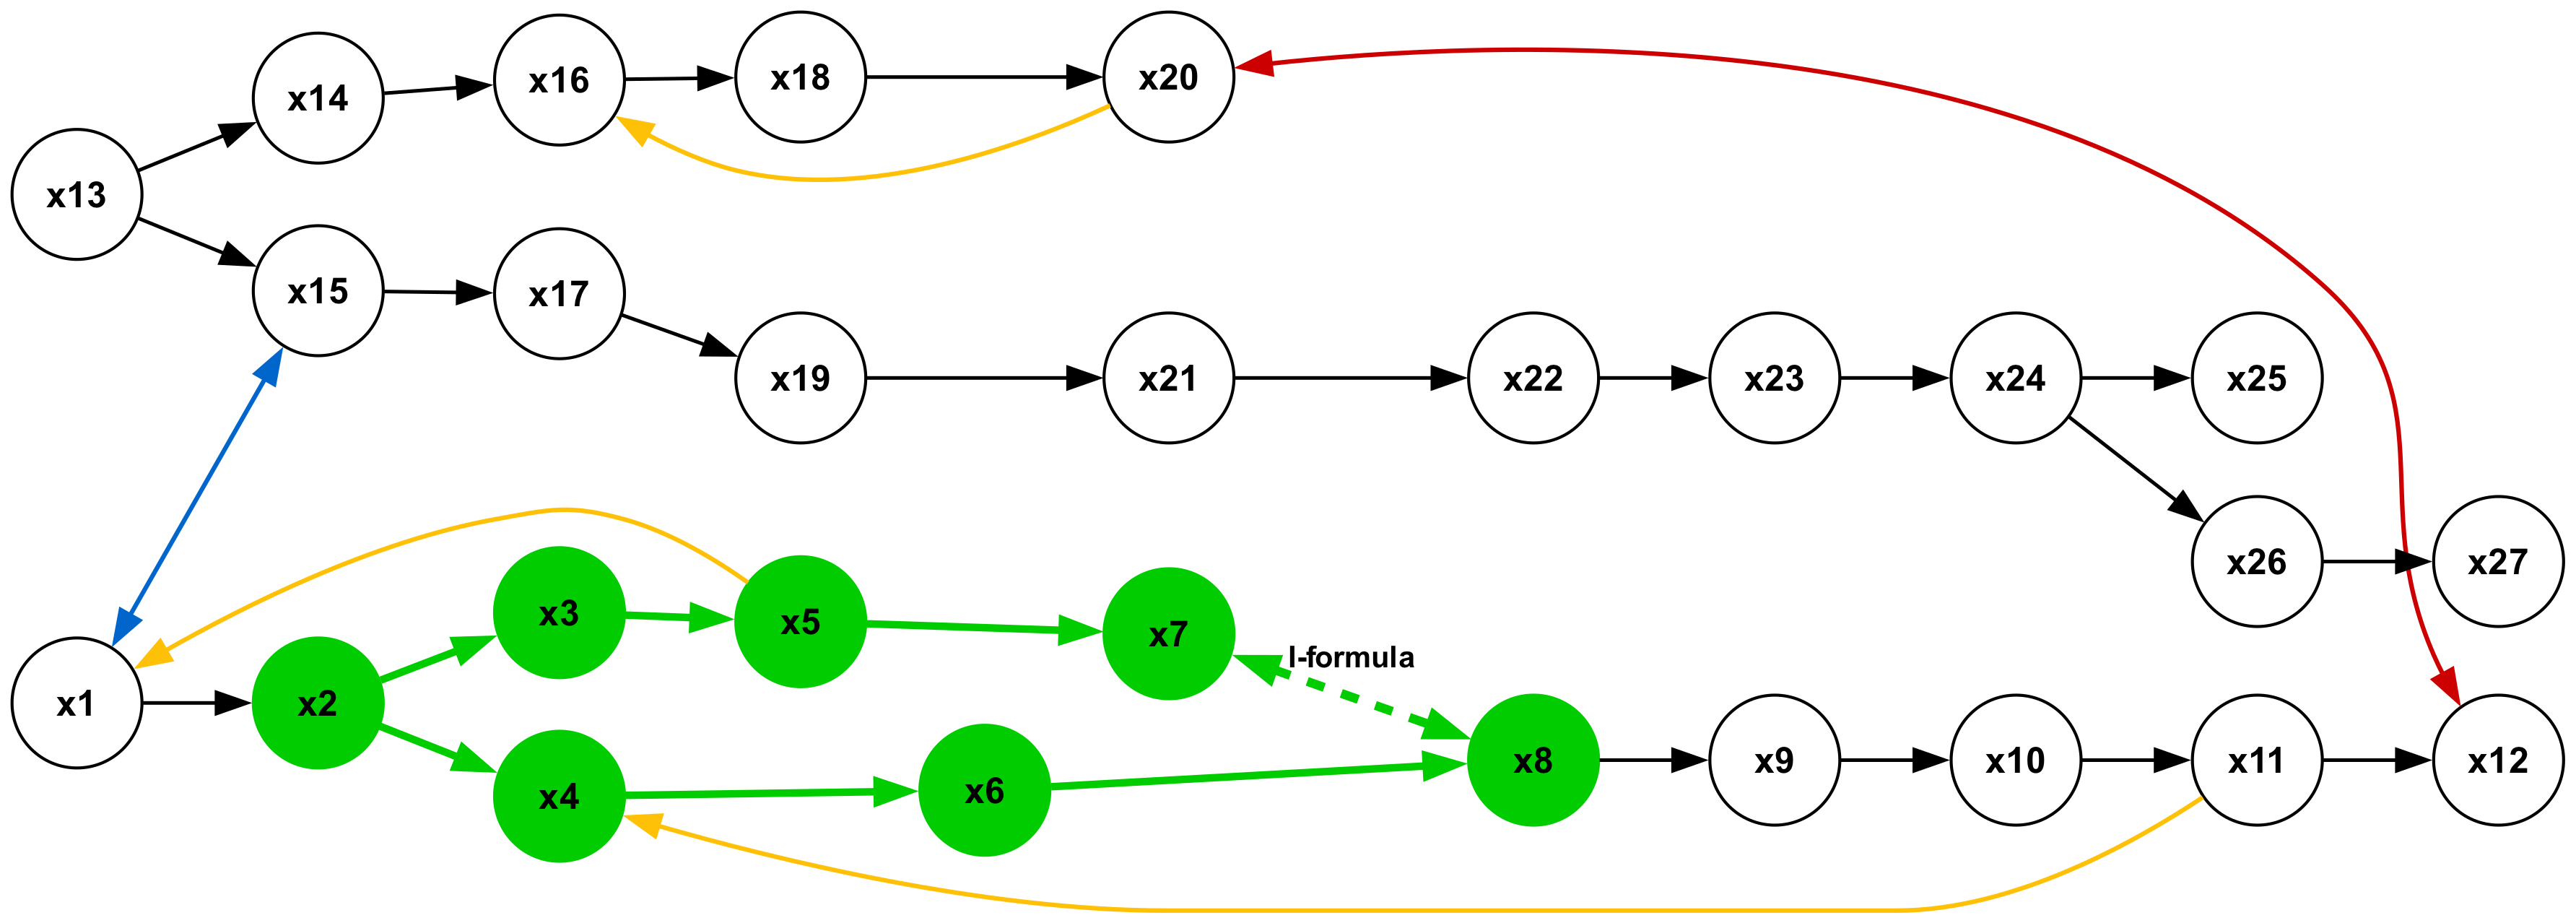
The image is a flowchart depicting a series of processes or steps, represented by labeled circles (x1 to x27). The arrows indicate the direction of flow between these processes. The diagram includes branching paths and feedback loops, suggesting a complex system with multiple possible sequences of events. Some nodes are colored green, while others are white. The arrows are colored black, blue, red, green, and yellow, indicating different types of relationships or dependencies.
### Components/Axes
* **Nodes:** Represented by circles labeled x1 through x27. Some nodes (x2, x3, x4, x5, x6, x7, x8) are filled with green color, while the rest are white.
* **Arrows:** Indicate the flow of processes. The arrows are colored black, blue, red, green, and yellow.
* **Labels:** Each node is labeled with "x" followed by a number (1-27).
* **Special Arrow:** A dashed green arrow labeled "I-formula" connects node x7 to node x8.
### Detailed Analysis
* **Starting Point:** The process begins at node x1.
* **Branching from x1:**
* A black arrow leads from x1 to x2.
* A blue arrow leads from x1 to x15.
* **Green Nodes (x2, x3, x4, x5, x6, x7, x8):**
* x2 branches into x3 and x4 via green arrows.
* x3 leads to x5 via a green arrow.
* x4 leads to x6 via a green arrow.
* x5 leads to x7 via a green arrow.
* x6 leads to x8 via a green arrow.
* x7 leads to x8 via a dashed green arrow labeled "I-formula".
* x8 leads to x9 via a black arrow.
* **Upper Branch (x13 to x20):**
* x13 branches into x14 and x15 via black arrows.
* x14 leads to x16 via a black arrow.
* x15 leads to x17 via a black arrow.
* x16 leads to x18 via a black arrow.
* x17 leads to x19 via a black arrow.
* x18 leads to x20 via a black arrow.
* **Middle Branch (x19 to x27):**
* x19 leads to x21 via a black arrow.
* x21 leads to x22 via a black arrow.
* x22 leads to x23 via a black arrow.
* x23 leads to x24 via a black arrow.
* x24 branches into x25 and x26 via black arrows.
* x25 leads to x27 via a black arrow.
* x26 leads to x27 via a black arrow.
* **Feedback Loops (Yellow Arrows):**
* A yellow arrow leads from x1 to x3.
* A yellow arrow leads from x4 to x1.
* A yellow arrow leads from x11 to x16.
* A yellow arrow leads from x18 to x2.
* **Red Arrow:** A red arrow leads from x20 to x12.
* **Final Nodes:**
* x9 leads to x10 via a black arrow.
* x10 leads to x11 via a black arrow.
* x11 leads to x12 via a black arrow.
* x27 leads to x12 via a black arrow.
### Key Observations
* The diagram has three main branches originating from x1 and x13.
* Nodes x2 through x8 are highlighted in green, suggesting a specific sub-process or state.
* Feedback loops (yellow arrows) indicate iterative processes or dependencies.
* The red arrow from x20 to x12 represents a significant connection between the upper branch and the final node.
* Node x12 is the final node, receiving input from x11, x20, and x27.
### Interpretation
The flowchart represents a complex system with multiple interconnected processes. The green nodes likely represent a critical path or a specific state within the system. The feedback loops suggest iterative processes or dependencies that influence the overall flow. The red arrow indicates a significant connection between different branches of the system. The diagram could represent a manufacturing process, a software algorithm, or any other system with multiple steps and dependencies. The "I-formula" label on the dashed green arrow suggests a calculation or transformation occurring between nodes x7 and x8. The diagram highlights the flow of information or materials through the system, identifying key decision points and dependencies.