\n
## Diagram: Process Flow with Interconnections
### Overview
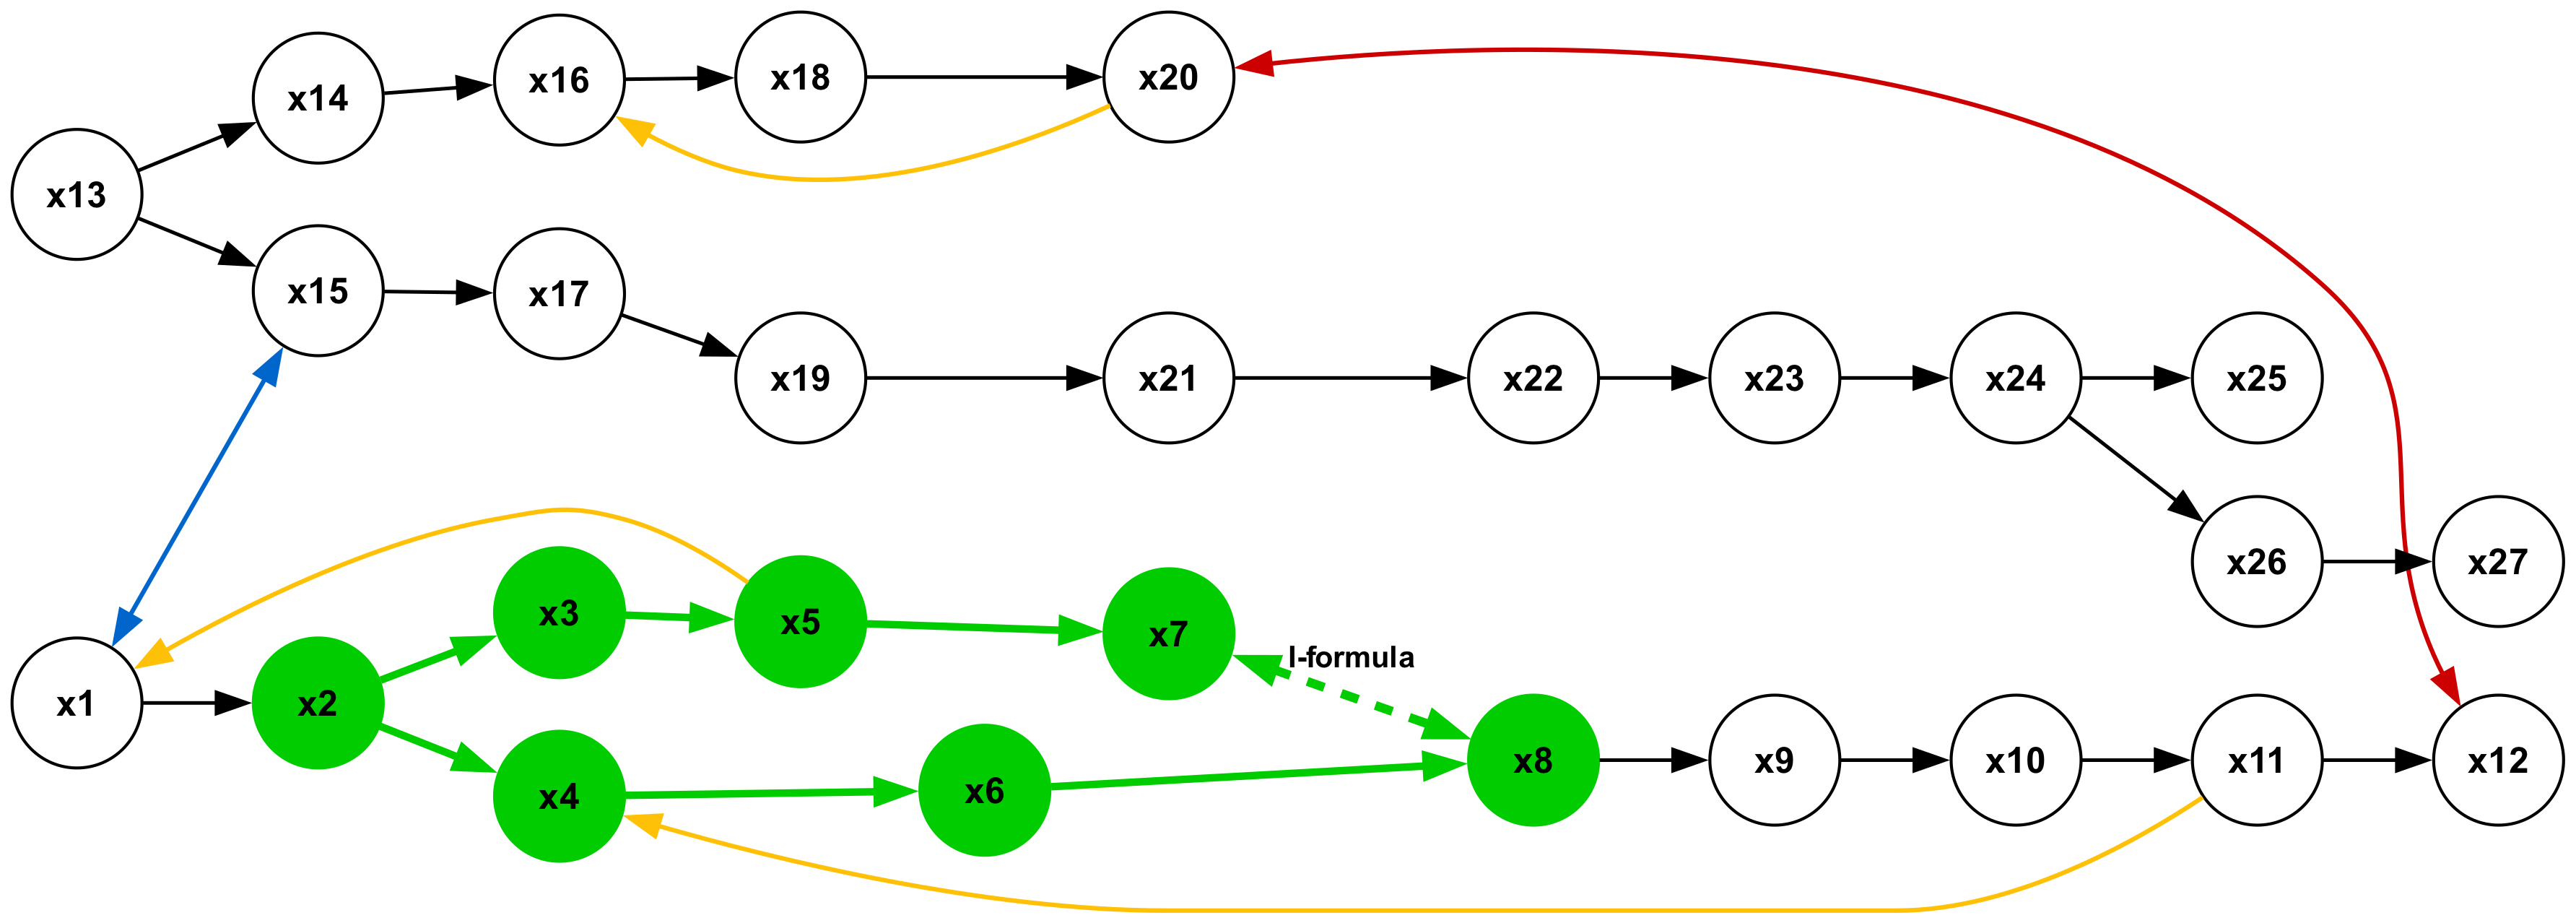
The image depicts a directed graph representing a process flow with 27 nodes labeled "x1" through "x27". The nodes are represented as circles, and the connections between them are represented by arrows indicating the direction of flow. The arrows are color-coded: orange, green, blue, and yellow, suggesting different pathways or types of connections. A dashed blue arrow with the label "I-formula" connects nodes x7 and x8.
### Components/Axes
The diagram consists of interconnected nodes (x1 to x27) and directed edges (arrows) between them. There are no explicit axes or scales. The color of the arrows appears to be a key element in understanding the different pathways.
### Detailed Analysis or Content Details
The diagram can be broken down into several interconnected sections:
* **Section 1 (Left):** Starts with x1, branching to x2, x3, and x4.
* x1 -> x2 (Blue)
* x1 -> x3 (Yellow)
* x1 -> x4 (Orange)
* **Section 2 (Top):** Starts with x13 and x14.
* x13 -> x15 (Grey)
* x14 -> x16 (Yellow)
* x16 -> x18 (Yellow)
* x18 -> x20 (Yellow)
* x15 -> x17 (Yellow)
* x17 -> x19 (Yellow)
* x19 -> x21 (Yellow)
* **Section 3 (Middle):** Connects x3, x4, x5, x6, x7, and x8.
* x2 -> x3 (Blue)
* x3 -> x5 (Green)
* x4 -> x6 (Orange)
* x5 -> x7 (Green)
* x6 -> x7 (Green)
* x7 -> x8 (Dashed Blue, labeled "I-formula")
* **Section 4 (Bottom):** Starts with x8 and continues to x12.
* x8 -> x9 (Green)
* x9 -> x10 (Green)
* x10 -> x11 (Green)
* x11 -> x12 (Green)
* **Section 5 (Right):** Connects x21, x22, x23, x24, x25, x26, and x27.
* x21 -> x22 (Yellow)
* x22 -> x23 (Yellow)
* x23 -> x24 (Yellow)
* x24 -> x25 (Yellow)
* x25 -> x26 (Black)
* x26 -> x27 (Red)
* **Cross-Connections:**
* x20 -> x21 (Red)
* x27 -> x4 (Red)
* x25 -> x7 (Black)
### Key Observations
* The diagram shows a complex network of interconnected processes.
* The color-coding of the arrows suggests different types of relationships or dependencies between the nodes.
* The "I-formula" connection between x7 and x8 is highlighted with a dashed line, indicating a potentially important or unique relationship.
* Node x7 appears to be a central hub, receiving input from x5, x6, and x25 and providing output to x8.
* Node x4 receives input from x1 and x27, suggesting it might be a convergence point.
* The red arrows represent long-range connections, potentially indicating feedback loops or critical pathways.
### Interpretation
The diagram likely represents a workflow or a system where different components (x1 to x27) interact with each other. The color-coded arrows could represent different types of data flow, control signals, or dependencies. The "I-formula" connection suggests a specific calculation or transformation applied to the data flowing between x7 and x8.
The presence of feedback loops (e.g., x27 -> x4) indicates that the system is dynamic and can adjust its behavior based on its output. The central role of x7 and x4 suggests that these nodes are critical for the overall functioning of the system.
The diagram could represent a variety of real-world systems, such as a manufacturing process, a software application, or a biological pathway. Without additional context, it is difficult to determine the specific meaning of the nodes and connections. However, the diagram provides a clear visual representation of the relationships between the different components of the system. The diagram is a visual representation of a complex system, and the connections between the nodes are likely to be important for understanding how the system works. The color-coding of the arrows suggests that there are different types of relationships between the nodes, and the "I-formula" connection is likely to be a key part of the system.