## Directed Graph Diagram: Process Flow or Dependency Network
### Overview
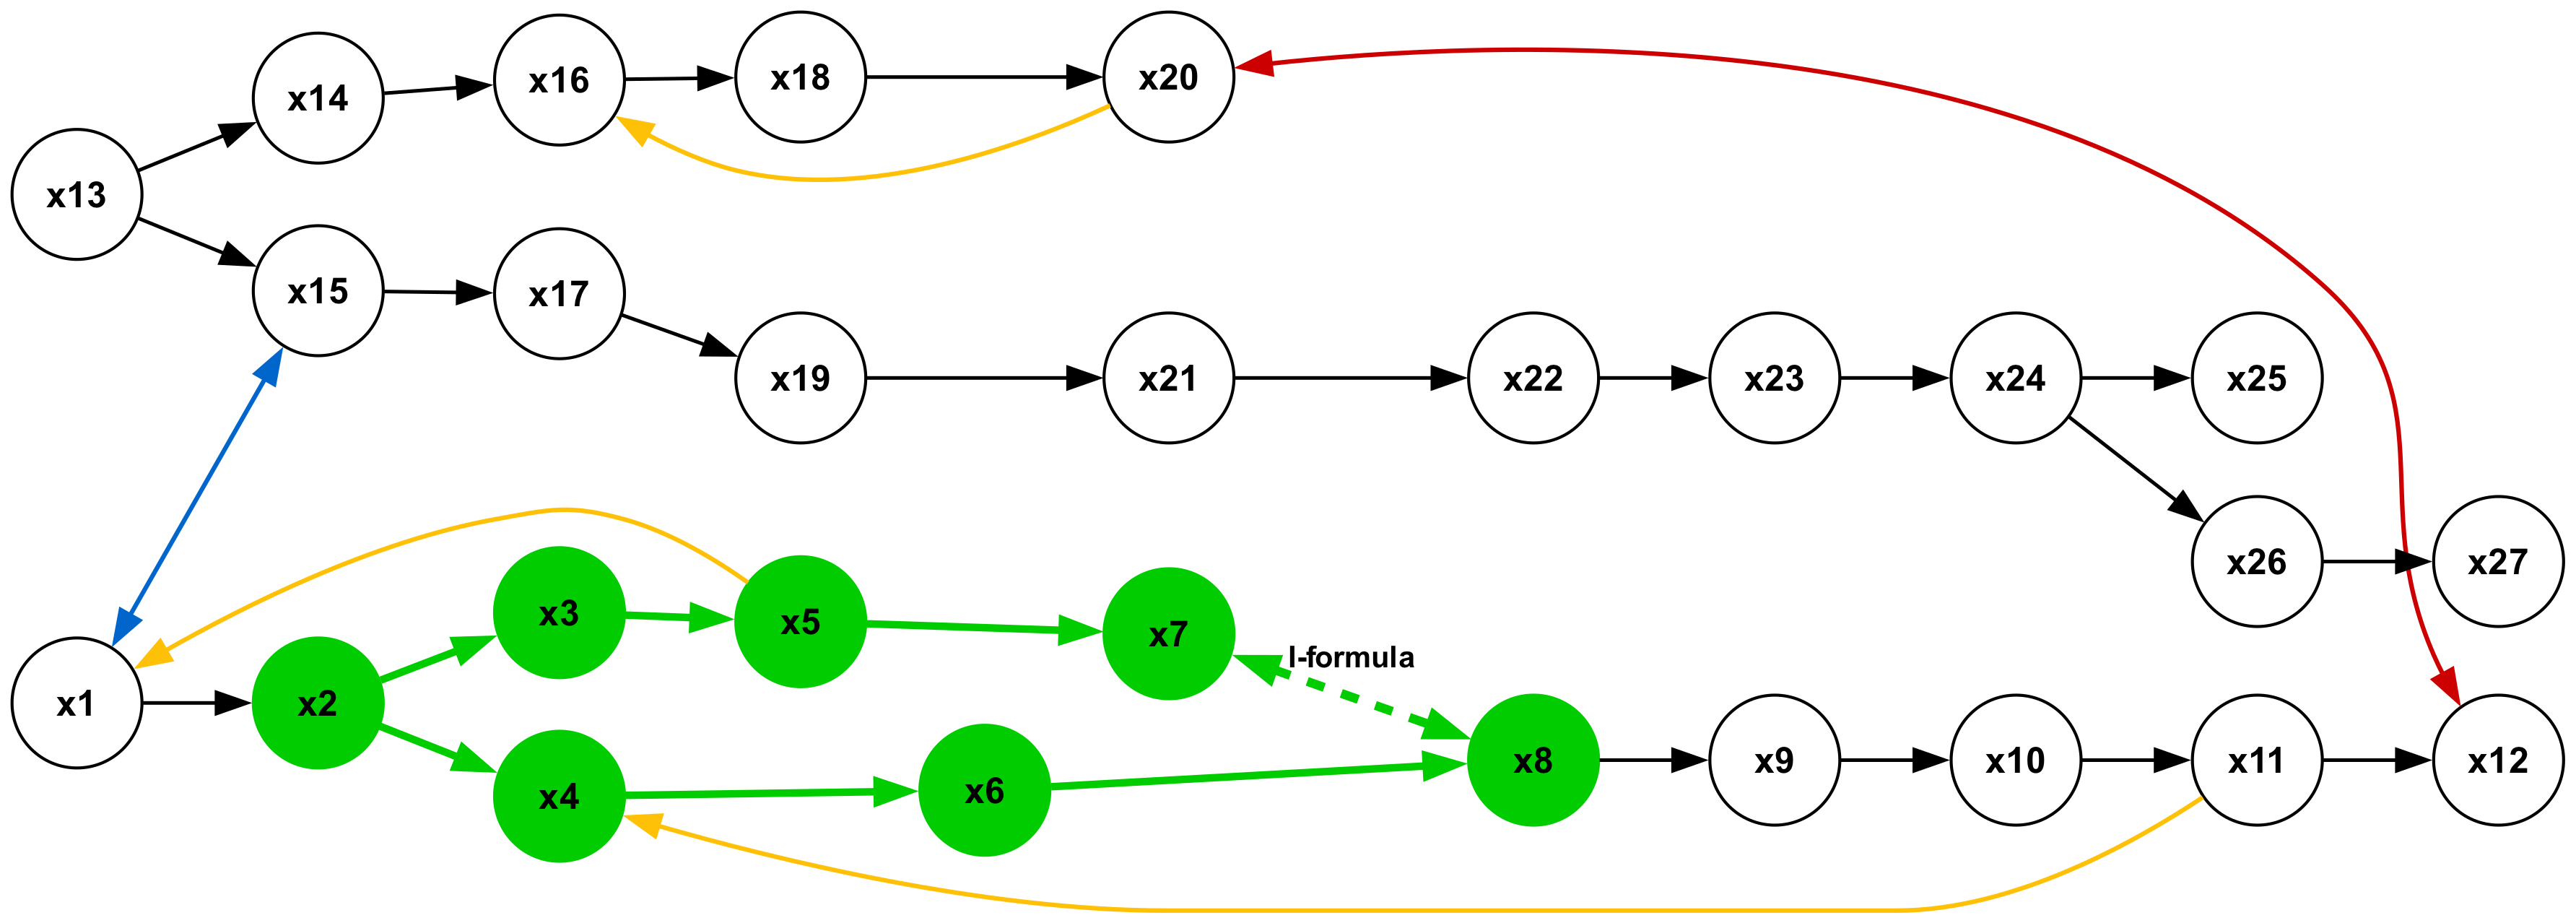
The image displays a directed graph (network diagram) consisting of 27 circular nodes labeled `x1` through `x27`. The nodes are interconnected by directed arrows of various colors, indicating a flow or dependency relationship. The graph is organized into three approximate horizontal layers. A subset of nodes (`x2`, `x3`, `x4`, `x5`, `x6`, `x7`, `x8`) is highlighted in green, suggesting a distinct group or process phase. A specific relationship between nodes `x7` and `x8` is labeled with the text "I-formula".
### Components/Axes
* **Nodes:** 27 circular nodes, each containing a unique label from `x1` to `x27`.
* **Color Coding:** Nodes `x2`, `x3`, `x4`, `x5`, `x6`, `x7`, and `x8` are filled with a solid green color. All other nodes (`x1`, `x9`-`x27`) are white with a black outline.
* **Edges (Arrows):** Directed arrows connecting nodes, color-coded as follows:
* **Black:** The majority of arrows, indicating standard flow or dependency.
* **Blue:** One arrow from `x15` to `x1`.
* **Yellow/Orange:** Three arrows: `x20` to `x16`, `x11` to `x4`, and `x1` to `x5`.
* **Red:** Two long, curved arrows: `x20` to `x27` and `x27` to `x12`.
* **Green:** Arrows connecting the green nodes (`x2` through `x8`).
* **Dashed Green:** One arrow from `x7` to `x8`, labeled with the text "I-formula".
* **Text Label:** The string "I-formula" is placed above the dashed green arrow connecting `x7` to `x8`.
### Detailed Analysis
**Spatial Layout & Node Connections:**
The graph can be segmented into three primary horizontal regions:
1. **Top Layer (Nodes x13, x14, x16, x18, x20):**
* `x13` (leftmost) has two outgoing black arrows: to `x14` and `x15`.
* `x14` → `x16` (black).
* `x16` → `x18` (black).
* `x18` → `x20` (black).
* A yellow/orange arrow curves from `x20` back to `x16`.
* A red arrow originates from `x20` and curves down to `x27` in the middle layer.
2. **Middle Layer (Nodes x15, x17, x19, x21, x22, x23, x24, x25, x26, x27):**
* `x15` receives arrows from `x13` (black) and `x1` (blue). It has one outgoing black arrow to `x17`.
* `x17` → `x19` (black).
* `x19` → `x21` (black).
* `x21` → `x22` (black).
* `x22` → `x23` (black).
* `x23` → `x24` (black).
* `x24` splits: one black arrow to `x25`, another to `x26`.
* `x26` → `x27` (black).
* `x27` receives the red arrow from `x20` and has a red arrow pointing to `x12` in the bottom layer.
3. **Bottom Layer (Nodes x1, x2-x8 (green), x9, x10, x11, x12):**
* `x1` has a black arrow to `x2` and a yellow/orange arrow to `x5`. It receives a blue arrow from `x15`.
* **Green Node Subgraph:**
* `x2` → `x3` (green) and `x2` → `x4` (green).
* `x3` → `x5` (green).
* `x4` → `x6` (green).
* `x5` → `x7` (green).
* `x6` → `x8` (green).
* `x7` → `x8` (dashed green, labeled "I-formula").
* `x8` → `x9` (black).
* `x9` → `x10` (black).
* `x10` → `x11` (black).
* `x11` → `x12` (black). A yellow/orange arrow also curves from `x11` back to `x4`.
* `x12` receives arrows from `x11` (black) and `x27` (red).
### Key Observations
1. **Highlighted Path:** The green nodes (`x2` through `x8`) form a distinct, internally connected subgraph. The dashed arrow labeled "I-formula" between `x7` and `x8` is a unique, annotated relationship within this group.
2. **Feedback Loops:** The diagram contains several feedback or backward connections, indicated by the yellow/orange arrows: `x20`→`x16`, `x11`→`x4`, and `x1`→`x5`.
3. **Long-Range Connections:** The red arrows (`x20`→`x27` and `x27`→`x12`) create long-range dependencies from the top layer to the middle and then to the bottom layer, bypassing the intermediate sequential flow.
4. **Cross-Layer Connection:** The blue arrow from `x15` (middle layer) to `x1` (bottom layer) is the only connection of its color, linking the two main horizontal flows.
5. **Branching and Convergence:** The graph shows branching (e.g., `x13` to `x14`/`x15`, `x24` to `x25`/`x26`) and convergence (e.g., `x8` receives inputs from `x6` and `x7`; `x12` receives inputs from `x11` and `x27`).
### Interpretation
This diagram likely represents a **complex process flow, dependency network, or computational graph**. The structure suggests a system with multiple parallel and sequential stages.
* **The Green Subgraph (`x2`-`x8`):** This is the most salient feature. It could represent a **core algorithm, a critical processing module, or a specific mathematical transformation** (hinted at by the "I-formula" label). Its internal green arrows show a defined flow within this module.
* **Primary Flow:** The main sequential flow appears to run from `x13` through the top and middle layers (`x13`→...→`x27`) and from `x1` through the bottom layer (`x1`→...→`x12`). These two main streams are interconnected at key points (`x15`→`x1`, `x27`→`x12`).
* **Feedback Mechanisms:** The yellow/orange arrows indicate **feedback loops or iterative processes**, where the output of a later stage (`x20`, `x11`, `x1`) influences an earlier stage (`x16`, `x4`, `x5`). This is common in control systems, optimization algorithms, or recursive computations.
* **System Integration:** The red and blue arrows act as **integration or synchronization points**, linking disparate parts of the network. The red path (`x20`→`x27`→`x12`) might represent a shortcut, an override, or a final aggregation step that combines results from the top-level process with the bottom-level process.
**In summary, the graph depicts a sophisticated system where a core, formula-driven process (green nodes) is embedded within a larger workflow that includes sequential execution, parallel branching, feedback loops, and long-range integrative connections.** The "I-formula" is a key, explicitly noted operation within the core module.