# Technical Document Extraction: Flowchart Analysis
## Diagram Overview
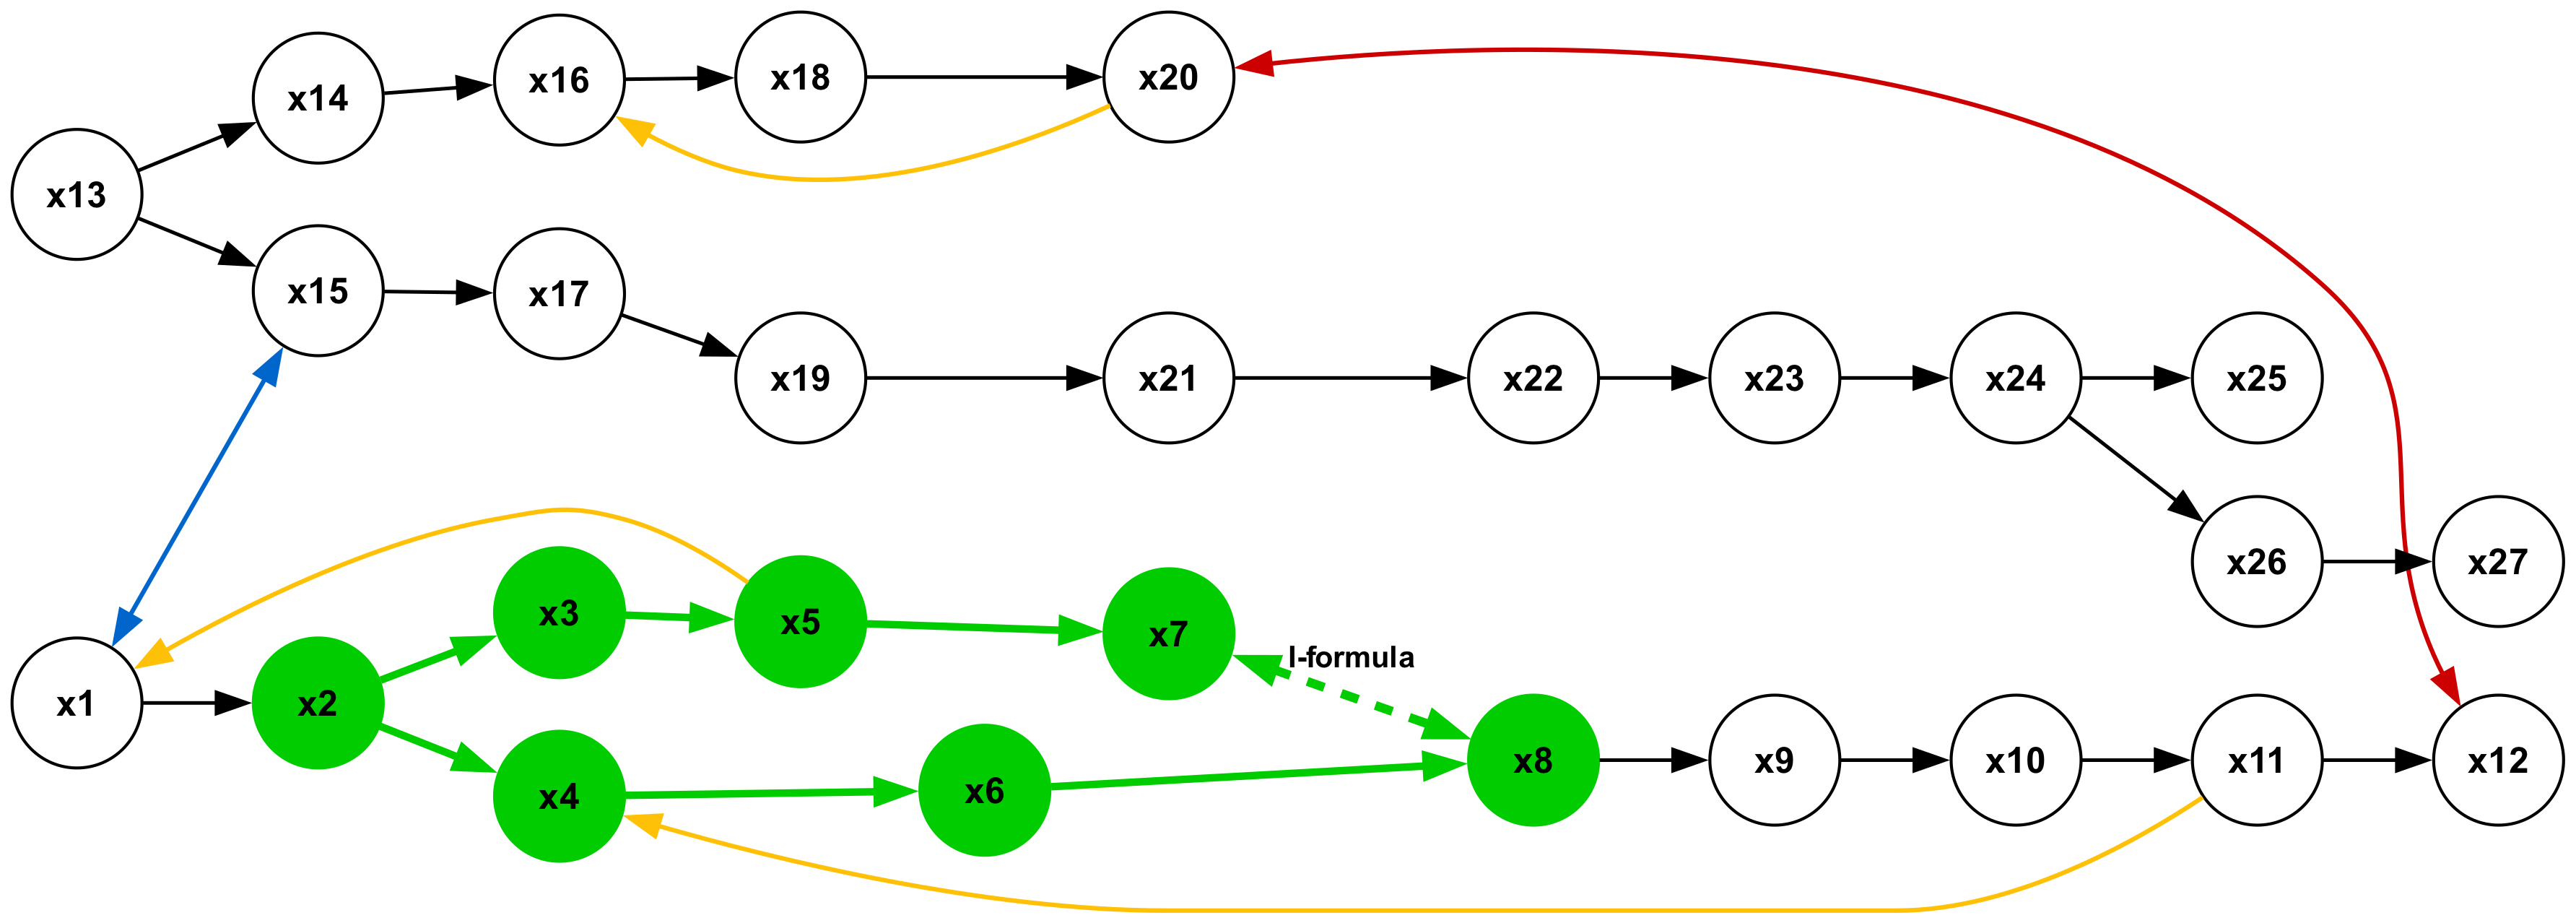
The image depicts a complex directed graph with 27 nodes labeled `x1` to `x27`. Nodes are color-coded and interconnected via arrows of varying colors, indicating different flow paths or relationships.
---
## Node Classification
### Green Nodes (x1–x8)
- **Subgraph Structure**: Forms a tightly connected cluster with bidirectional and cyclic flows.
- **Key Features**:
- **I-formula**: Dashed arrow from `x7` to `x8` (purpose unspecified).
- **Loops**:
- Yellow arrow from `x1` to `x12` (external loop).
- Blue arrow from `x13` to `x15` (internal loop).
- **Branching**:
- `x2` → `x3` and `x4` (divergent paths).
- `x6` → `x8` (convergent path).
### Black Nodes (x9–x27)
- **Linear Chain**: Forms a sequential path from `x9` to `x27` with embedded loops.
- **Key Features**:
- **Red Loop**: From `x20` to `x27` (cyclic dependency).
- **Yellow Loop**: From `x1` to `x12` (external influence on black nodes).
- **Branching**:
- `x24` → `x26` (divergent path).
- `x26` → `x27` (convergent path).
---
## Arrow Color Coding
| Color | Function | Example Paths |
|--------|-----------------------------------|----------------------------------------|
| Black | Primary flow | `x13` → `x14` → `x16` → `x18` → `x20` |
| Red | Cyclic/feedback loop | `x20` → `x27` (loop) |
| Yellow | External/alternative path | `x1` → `x12` (loop) |
| Blue | Specialized/conditional flow | `x13` → `x15` (loop) |
| Green | Internal subgraph connections | `x3` → `x5` → `x7` → `x8` |
---
## Spatial Grounding & Component Isolation
### Header Region
- No explicit header; diagram begins with `x1` (green node).
### Main Chart
- **Green Subgraph (x1–x8)**:
- Coordinates: Nodes clustered in lower-left quadrant.
- Flow: Complex interconnections with loops and branches.
- **Black Chain (x9–x27)**:
- Coordinates: Linear progression from center-right to upper-right.
- Flow: Sequential with embedded loops.
### Footer Region
- No explicit footer; diagram ends with `x27`.
---
## Trend Verification
1. **Green Subgraph**:
- **Trend**: Highly interconnected with multiple feedback loops.
- **Data Points**:
- `x1` → `x2` → `x3` → `x5` → `x7` → `x8` (primary path).
- `x4` → `x6` → `x8` (alternative path).
2. **Black Chain**:
- **Trend**: Linear progression with terminal loop.
- **Data Points**:
- `x9` → `x10` → ... → `x27` (sequential).
- `x20` → `x27` (red loop).
---
## Missing Elements
- **Legend**: Not present; color coding inferred from node/arrow usage.
- **Axis Titles**: Not applicable (flowchart, not a heatmap/chart).
---
## Critical Observations
1. The "I-formula" label on the dashed arrow (`x7` → `x8`) suggests a special relationship, possibly an initialization or iterative process.
2. The red loop (`x20` → `x27`) and yellow loop (`x1` → `x12`) indicate cyclical dependencies that may require stabilization.
3. Blue and yellow arrows represent non-primary flows, potentially conditional or alternative pathways.
---
## Conclusion
This flowchart represents a hybrid system with a core green subgraph (x1–x8) and a linear black chain (x9–x27), interconnected via colored arrows. The presence of multiple loops and branches suggests dynamic behavior requiring further analysis for optimization or error mitigation.