## Line Charts: Llama-3 Model Layer-wise ΔP Analysis
### Overview
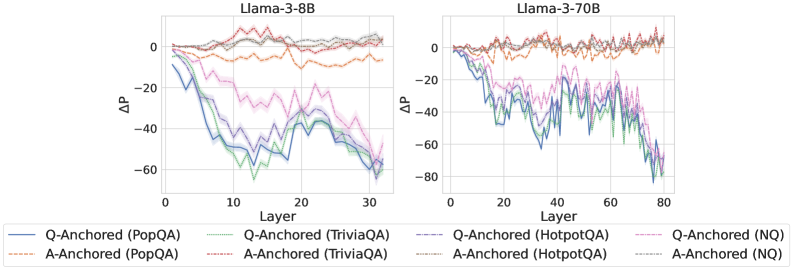
The image displays two side-by-side line charts comparing the layer-wise change in probability (ΔP) for two different-sized language models: Llama-3-8B (left) and Llama-3-70B (right). The charts analyze the performance of two anchoring methods (Q-Anchored and A-Anchored) across four different question-answering datasets (PopQA, TriviaQA, HotpotQA, NQ).
### Components/Axes
* **Chart Titles:** "Llama-3-8B" (left chart), "Llama-3-70B" (right chart).
* **Y-Axis:** Labeled "ΔP" (Delta P, likely representing a change in probability or performance metric). The scale ranges from -80 to 0, with major gridlines at intervals of 20.
* **X-Axis:** Labeled "Layer". The scale for Llama-3-8B ranges from 0 to 30. The scale for Llama-3-70B ranges from 0 to 80.
* **Legend:** Positioned at the bottom, spanning both charts. It defines eight data series using a combination of line color and style (solid vs. dashed):
* **Q-Anchored (Solid Lines):**
* Blue: PopQA
* Green: TriviaQA
* Purple: HotpotQA
* Pink: NQ
* **A-Anchored (Dashed Lines):**
* Orange: PopQA
* Red: TriviaQA
* Brown: HotpotQA
* Gray: NQ
### Detailed Analysis
**Llama-3-8B Chart (Left):**
* **Q-Anchored Series (Solid Lines):** All four solid lines show a pronounced downward trend, indicating a significant negative ΔP as the layer number increases.
* The **Blue (PopQA)** and **Green (TriviaQA)** lines exhibit the steepest decline, dropping from near 0 at layer 0 to approximately -60 by layer 30. Their lowest points are around layers 15-20.
* The **Purple (HotpotQA)** and **Pink (NQ)** lines follow a similar but slightly less severe downward trajectory, ending near -50 by layer 30.
* **A-Anchored Series (Dashed Lines):** All four dashed lines remain relatively stable and close to the zero line throughout all layers, fluctuating mostly between -10 and +5. They show no strong downward or upward trend.
**Llama-3-70B Chart (Right):**
* **Q-Anchored Series (Solid Lines):** The pattern is more volatile but follows the same core trend as the 8B model. The lines show a general decline with significant fluctuations.
* The **Blue (PopQA)**, **Green (TriviaQA)**, and **Purple (HotpotQA)** lines all descend sharply, reaching values between -60 and -80 by layer 80. The **Pink (NQ)** line also declines but ends slightly higher, around -50.
* The decline appears to accelerate after approximately layer 40.
* **A-Anchored Series (Dashed Lines):** Similar to the 8B model, the dashed lines for A-Anchored methods remain clustered near the zero line across all layers, showing minor fluctuations but no significant drift.
### Key Observations
1. **Method Dichotomy:** There is a stark and consistent contrast between the two anchoring methods. Q-Anchored methods (solid lines) result in a large, layer-dependent negative ΔP, while A-Anchored methods (dashed lines) maintain a ΔP near zero.
2. **Model Size Scaling:** The trend observed in the 8B model is amplified and extended in the larger 70B model. The negative ΔP for Q-Anchored methods reaches similar or greater magnitudes but is distributed across many more layers (80 vs. 30).
3. **Dataset Variation:** Within the Q-Anchored group, the PopQA (blue) and TriviaQA (green) datasets consistently show the most negative ΔP across both model sizes. The NQ (pink) dataset often shows the least negative ΔP among the Q-Anchored series.
4. **Volatility:** The Llama-3-70B chart exhibits greater high-frequency volatility (more jagged lines) in the Q-Anchored series compared to the Llama-3-8B chart.
### Interpretation
This data suggests a fundamental difference in how the "Q-Anchored" and "A-Anchored" techniques influence the internal processing of the Llama-3 models across their layers.
* **Q-Anchored Impact:** The strong negative ΔP trend for Q-Anchored methods indicates that this technique causes a progressive and significant reduction in the measured probability metric as information flows through the network's layers. This could imply that Q-Anchoring suppresses or alters the model's confidence or the probability assigned to certain outputs in a layer-wise manner. The effect is more pronounced for datasets like PopQA and TriviaQA.
* **A-Anchored Stability:** In contrast, A-Anchored methods appear to be largely neutral, preserving the ΔP near its initial value throughout the network. This suggests this technique does not induce the same layer-wise drift in the model's internal representations for this metric.
* **Scaling Effect:** The pattern holds across model scales (8B to 70B parameters), but the larger model's deeper architecture allows the effect to manifest over a longer sequence of layers, with increased volatility possibly reflecting more complex internal dynamics.
**In essence, the charts demonstrate that the choice of anchoring method (Q vs. A) is a critical determinant of layer-wise behavior in Llama-3 models, with Q-Anchoring introducing a strong, dataset-sensitive, and layer-dependent suppression effect that scales with model depth.**