## Line Graph: Performance Comparison of Q-Anchored and A-Anchored Models Across Layers for Llama-3-8B and Llama-3-70B
### Overview
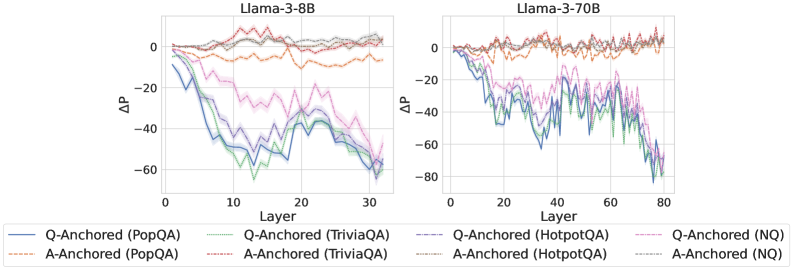
The image contains two side-by-side line graphs comparing the performance (ΔP) of Q-Anchored and A-Anchored models across layers for two Llama versions: 3-8B (left) and 3-70B (right). The graphs show six distinct data series, each representing a combination of anchoring method (Q or A) and dataset/method (PopQA, TriviaQA, HotpotQA, NQ). Performance is measured as ΔP (change in performance) across layers, with values ranging from -80 to +20.
### Components/Axes
- **X-Axis (Horizontal)**: Layer (0 to 30 for Llama-3-8B, 0 to 80 for Llama-3-70B)
- **Y-Axis (Vertical)**: ΔP (Performance Change, range: -80 to +20)
- **Legend**: Located at the bottom, with six entries:
1. **Q-Anchored (PopQA)**: Solid blue line
2. **Q-Anchored (TriviaQA)**: Dotted green line
3. **Q-Anchored (HotpotQA)**: Dashed purple line
4. **Q-Anchored (NQ)**: Dotted pink line
5. **A-Anchored (PopQA)**: Solid orange line
6. **A-Anchored (TriviaQA)**: Dotted orange line
7. **A-Anchored (HotpotQA)**: Dashed orange line
8. **A-Anchored (NQ)**: Dotted gray line
### Detailed Analysis
#### Llama-3-8B (Left Chart)
- **Q-Anchored (PopQA)**: Starts near 0, decreases sharply to ~-60 by layer 30.
- **Q-Anchored (TriviaQA)**: Begins at ~-10, fluctuates between -20 and 0, ending near -40.
- **Q-Anchored (HotpotQA)**: Starts at ~-5, peaks at ~+5 around layer 15, then drops to ~-30.
- **Q-Anchored (NQ)**: Starts at ~-15, stabilizes near -10 by layer 30.
- **A-Anchored (PopQA)**: Starts at ~-5, fluctuates between -10 and 0, ending near -15.
- **A-Anchored (TriviaQA)**: Begins at ~-20, rises to ~-5 by layer 10, then drops to ~-35.
- **A-Anchored (HotpotQA)**: Starts at ~-10, peaks at ~+10 around layer 15, then declines to ~-25.
- **A-Anchored (NQ)**: Starts at ~-25, stabilizes near -20 by layer 30.
#### Llama-3-70B (Right Chart)
- **Q-Anchored (PopQA)**: Starts near 0, decreases to ~-70 by layer 80.
- **Q-Anchored (TriviaQA)**: Begins at ~-10, fluctuates between -30 and -10, ending near -50.
- **Q-Anchored (HotpotQA)**: Starts at ~-5, peaks at ~+10 around layer 40, then drops to ~-60.
- **Q-Anchored (NQ)**: Starts at ~-20, stabilizes near -30 by layer 80.
- **A-Anchored (PopQA)**: Starts at ~-5, fluctuates between -15 and 0, ending near -20.
- **A-Anchored (TriviaQA)**: Begins at ~-20, rises to ~-5 by layer 20, then drops to ~-40.
- **A-Anchored (HotpotQA)**: Starts at ~-10, peaks at ~+15 around layer 40, then declines to ~-35.
- **A-Anchored (NQ)**: Starts at ~-25, stabilizes near -35 by layer 80.
### Key Observations
1. **General Trend**: Most lines show a downward trend in ΔP as layers increase, indicating performance degradation.
2. **Model Size Impact**: Llama-3-70B exhibits more pronounced fluctuations and steeper declines compared to Llama-3-8B.
3. **Anchoring Method**: Q-Anchored models generally perform worse (lower ΔP) than A-Anchored models across most datasets.
4. **Dataset Variability**: HotpotQA and NQ datasets show higher volatility in performance compared to PopQA and TriviaQA.
5. **Layer-Specific Peaks**: Some lines (e.g., Q-Anchored HotpotQA in Llama-3-70B) show mid-layer performance peaks before declining.
### Interpretation
The data suggests that anchoring method (Q vs. A) and dataset choice significantly influence model performance. A-Anchored models consistently outperform Q-Anchored counterparts, particularly in larger models (70B). The HotpotQA and NQ datasets appear more challenging, causing sharper performance drops. The mid-layer peaks observed in some lines (e.g., HotpotQA) may indicate temporary stabilization or optimization points. The larger model (70B) shows greater sensitivity to anchoring choices, with more extreme performance variations. These trends highlight the importance of anchoring strategy and dataset selection in fine-tuning large language models.