## Line Chart: Reward vs. Performance over Steps
### Overview
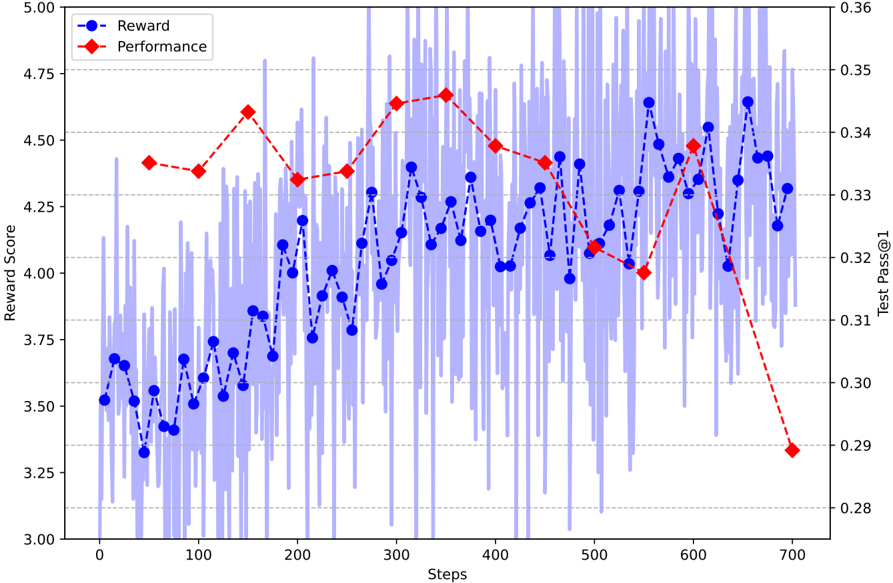
The image is a line chart comparing "Reward" and "Performance" over a number of "Steps." The "Reward" data is represented by a blue line with circular markers, plotted against the left y-axis labeled "Reward Score." The "Performance" data is represented by a red line with diamond markers, plotted against the right y-axis labeled "Test Pass@1." There is also a shaded blue region that represents the reward score.
### Components/Axes
* **X-axis:** "Steps," ranging from 0 to 700 in increments of 100.
* **Left Y-axis:** "Reward Score," ranging from 3.00 to 5.00 in increments of 0.25.
* **Right Y-axis:** "Test Pass@1," ranging from 0.28 to 0.36 in increments of 0.01.
* **Legend (top-left):**
* Blue line with circle markers: "Reward"
* Red line with diamond markers: "Performance"
### Detailed Analysis
* **Reward (Blue Line):** The reward line starts at approximately 3.5, fluctuates between 3.3 and 3.7 up to step 100. It then increases to approximately 4.2 by step 200. It then fluctuates between 3.8 and 4.4 until step 700.
* Step 0: ~3.5
* Step 100: ~3.4
* Step 200: ~4.2
* Step 300: ~4.3
* Step 400: ~4.2
* Step 500: ~4.1
* Step 600: ~4.4
* Step 700: ~4.3
* **Performance (Red Line):** The performance line starts at approximately 0.34 at step 0, decreases slightly to approximately 0.33 at step 100, then increases to approximately 0.345 at step 200. It then decreases to approximately 0.33 at step 300, then increases to approximately 0.35 at step 400. It then decreases to approximately 0.34 at step 500, then decreases to approximately 0.32 at step 600. It then decreases to approximately 0.29 at step 700.
* Step 0: ~0.34
* Step 100: ~0.335
* Step 200: ~0.345
* Step 300: ~0.33
* Step 400: ~0.35
* Step 500: ~0.34
* Step 600: ~0.32
* Step 700: ~0.29
* **Reward Score (Blue Shaded Region):** The blue shaded region fluctuates significantly throughout the steps, indicating high variability in the reward score at each step.
### Key Observations
* The "Reward" fluctuates more than the "Performance."
* The "Performance" generally decreases towards the end of the steps.
* The "Reward" and "Performance" do not appear to be strongly correlated.
### Interpretation
The chart illustrates the relationship between "Reward" and "Performance" over a series of steps. The "Reward" fluctuates, suggesting variability in the reward system. The "Performance" shows a general decrease towards the end, which could indicate a decline in the system's ability to perform well over time or with more steps. The lack of strong correlation between the two metrics suggests that the reward system may not be directly influencing the performance, or that other factors are at play. The high variability in the reward score, as indicated by the shaded region, suggests that the reward system may be inconsistent or sensitive to small changes in the environment.