## Dual-Axis Line Chart: Reward Score vs. Test Pass@1 Over Training Steps
### Overview
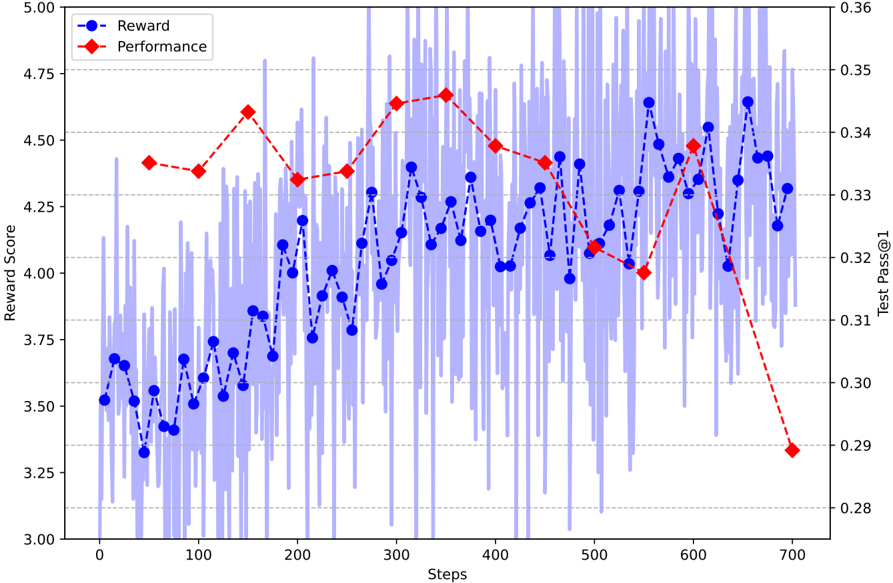
The image is a dual-axis line chart plotting two metrics, "Reward" and "Performance," against training "Steps." The chart displays a high-frequency, noisy signal for the Reward metric (blue) overlaid with a smoother, less frequent Performance metric (red). A shaded blue region indicates the variance or raw data for the Reward score.
### Components/Axes
* **X-Axis (Bottom):** Labeled "Steps." Linear scale ranging from 0 to 700, with major tick marks every 100 steps (0, 100, 200, 300, 400, 500, 600, 700).
* **Primary Y-Axis (Left):** Labeled "Reward Score." Linear scale ranging from 3.00 to 5.00, with major tick marks every 0.25 units (3.00, 3.25, 3.50, 3.75, 4.00, 4.25, 4.50, 4.75, 5.00).
* **Secondary Y-Axis (Right):** Labeled "Test Pass@1." Linear scale ranging from 0.28 to 0.36, with major tick marks every 0.01 units (0.28, 0.29, 0.30, 0.31, 0.32, 0.33, 0.34, 0.35, 0.36).
* **Legend (Top-Left Corner):**
* Blue line with circle markers: "Reward"
* Red dashed line with diamond markers: "Performance"
* **Data Series:**
1. **Reward (Blue):** A solid blue line with circular markers, connected by a dashed line. It is accompanied by a light blue shaded area representing the underlying high-frequency data or variance.
2. **Performance (Red):** A red dashed line with diamond-shaped markers.
### Detailed Analysis
**1. Reward Series (Blue Line - Left Axis):**
* **Trend:** The series exhibits high volatility with a general upward trend from step 0 to approximately step 650, followed by a slight decline.
* **Key Data Points (Approximate):**
* Step 0: ~3.52
* Step 100: ~3.55
* Step 200: ~4.00
* Step 300: ~4.15
* Step 400: ~4.05
* Step 500: ~4.10
* Step 600: ~4.45
* Step 650 (Peak): ~4.65
* Step 700: ~4.30
* **Variance (Shaded Blue Area):** The raw data shows extreme fluctuation, with values frequently spiking above 5.00 and dropping below 3.00 throughout the entire training process. The variance appears consistent across steps.
**2. Performance Series (Red Dashed Line - Right Axis):**
* **Trend:** The series shows a smoother trajectory. It rises to a peak around step 350, maintains a plateau with minor fluctuations until step 600, and then experiences a sharp, significant decline.
* **Key Data Points (Approximate):**
* Step 50: ~0.338
* Step 150: ~0.345
* Step 250: ~0.335
* Step 350 (Peak): ~0.348
* Step 450: ~0.340
* Step 550: ~0.320
* Step 600: ~0.338
* Step 700 (Trough): ~0.290
### Key Observations
1. **Inverse Relationship Post-Step 600:** After step 600, the Reward score (blue) remains relatively high (above 4.25), while the Test Pass@1 (red) plummets dramatically from ~0.338 to ~0.290.
2. **Volatility vs. Smoothness:** The Reward metric is extremely noisy, suggesting it is a direct, perhaps per-episode, training signal. The Performance metric is smoother and sampled less frequently (approximately every 50-100 steps), indicating it is likely an evaluation metric.
3. **Peak Misalignment:** The peak for Reward (~step 650) occurs *after* the peak for Performance (~step 350).
4. **High Variance:** The shaded blue area indicates that the instantaneous reward has a very wide distribution at every step, even as its moving average (the blue line) trends upward.
### Interpretation
This chart likely visualizes the training dynamics of a reinforcement learning or iterative optimization model. The "Reward" is the internal training signal, while "Test Pass@1" is an external evaluation metric (e.g., accuracy on a test set).
The data suggests a potential **overfitting or reward hacking scenario**. The model continues to optimize for its internal reward signal (blue line remains high) even as its actual performance on the held-out test metric (red line) severely degrades after step 600. This indicates a decoupling between the proxy reward objective and the true goal.
The high variance in the reward signal is typical in RL, but the smooth evaluation curve shows the underlying policy's general capability. The plateau in performance from steps 150-600, despite a rising average reward, suggests the model was making incremental improvements that didn't translate to better test scores until later, or that the reward function became misaligned. The final collapse in performance is a critical anomaly, signaling a failure mode in the training process that requires investigation, such as adjusting the reward function, implementing early stopping, or modifying the evaluation frequency.