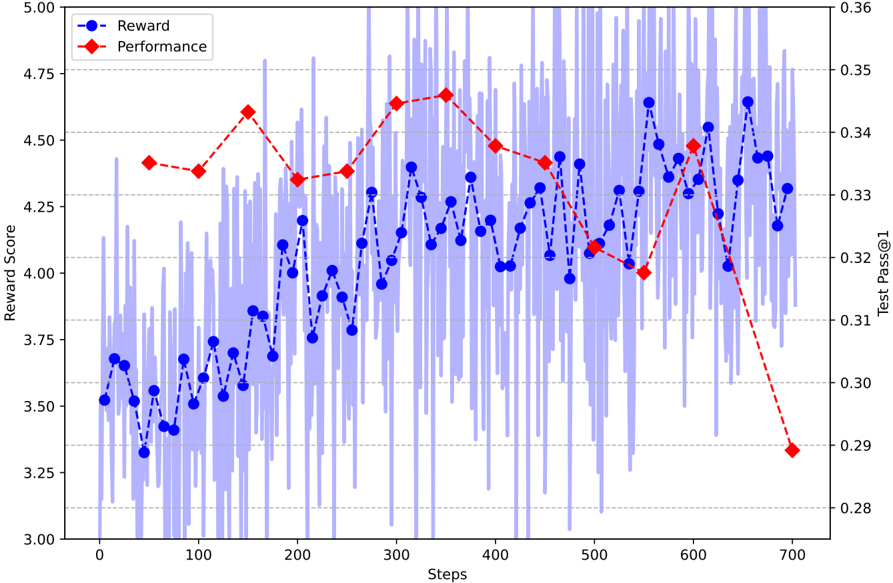
## Line Chart: Reward and Performance Metrics Over Steps
### Overview
The chart displays two time-series metrics (Reward and Performance) plotted against "Steps" (0-700) on the x-axis. A secondary y-axis on the right shows "Test Pass@1" values. The data exhibits volatility with distinct trends in reward accumulation and performance degradation over time.
### Components/Axes
- **Primary Axes**:
- **X-axis**: "Steps" (0-700, linear scale)
- **Left Y-axis**: "Reward Score" (3.00-5.00, linear scale)
- **Right Y-axis**: "Test Pass@1" (0.28-0.36, linear scale)
- **Legend**:
- Top-left corner with:
- Blue circles: "Reward"
- Red diamonds: "Performance"
- **Data Series**:
- Reward (blue dashed line with circles)
- Performance (red dashed line with diamonds)
- Test Pass@1 (blue shaded background)
### Detailed Analysis
1. **Reward Series**:
- Initial value: ~3.5 at step 0
- Gradual increase to peak of ~4.75 at step 150
- Post-peak volatility with oscillations between ~3.75-4.75
- Final value: ~3.25 at step 700
2. **Performance Series**:
- Initial value: ~4.4 at step 0
- Peak of ~4.7 at step 300
- Sharp decline after step 500, dropping to ~2.9 at step 700
- Notable inflection point at step 650 (red diamond drops from ~4.5 to ~2.9)
3. **Test Pass@1**:
- Initial value: ~0.33 at step 0
- Peak of ~0.35 at step 300
- Gradual decline to ~0.29 at step 700
- Correlated with Performance series but lags by ~100 steps
### Key Observations
- **Inverse Relationship**: After step 500, Reward and Performance trends diverge sharply (Reward rises while Performance falls)
- **System Instability**: Test Pass@1 follows Performance trends with a 100-step lag, suggesting delayed system feedback
- **Critical Threshold**: Performance drops below 3.0 at step 650, coinciding with Test Pass@1 falling below 0.31
- **Volatility Patterns**: Both series show increased fluctuation after step 200, with Reward exhibiting more frequent oscillations
### Interpretation
The data suggests a system optimization process that initially improves performance (steps 0-300) but experiences catastrophic failure after step 500. The Reward metric's post-peak increase may indicate reward hacking or unintended optimization pathways, while the Performance collapse correlates with Test Pass@1 degradation, implying real-world functionality breakdown. The 100-step lag between Performance and Test Pass@1 suggests delayed system validation mechanisms. The sharp Performance drop at step 650 could represent a parameter threshold violation or catastrophic failure mode activation. This pattern resembles reinforcement learning instability where reward maximization diverges from actual performance metrics.