## Chart: Amplitude Response vs. Frequency
### Overview
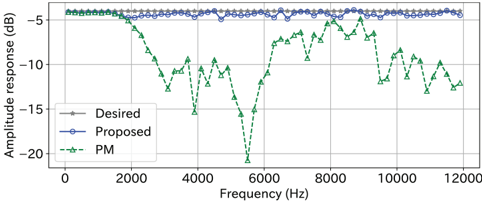
The image is a line chart comparing the amplitude response (in dB) of three different methods ("Desired", "Proposed", and "PM") across a range of frequencies (in Hz). The chart displays how the amplitude response changes with frequency for each method.
### Components/Axes
* **X-axis:** Frequency (Hz), ranging from 0 to 12000 Hz, with gridlines at intervals of 2000 Hz.
* **Y-axis:** Amplitude response (dB), ranging from -20 dB to -5 dB, with gridlines at intervals of 5 dB.
* **Legend:** Located in the bottom-left corner, it identifies the three methods:
* "Desired" (gray line with triangle markers)
* "Proposed" (blue line with circle markers)
* "PM" (green dashed line with triangle markers)
### Detailed Analysis
* **Desired (Gray Line):** The "Desired" amplitude response remains relatively constant at approximately -4 dB across the entire frequency range.
* At 0 Hz, the value is approximately -4 dB.
* At 12000 Hz, the value is approximately -4 dB.
* **Proposed (Blue Line):** The "Proposed" amplitude response also remains relatively constant, fluctuating slightly around -4 dB across the entire frequency range.
* At 0 Hz, the value is approximately -4 dB.
* At 12000 Hz, the value is approximately -4 dB.
* **PM (Green Dashed Line):** The "PM" amplitude response varies significantly with frequency.
* From 0 Hz to approximately 2000 Hz, it decreases from approximately -4 dB to approximately -6 dB.
* From 2000 Hz to approximately 6000 Hz, it decreases sharply to approximately -16 dB.
* From 6000 Hz to approximately 8000 Hz, it increases sharply to approximately -7 dB.
* From 8000 Hz to 12000 Hz, it fluctuates between approximately -7 dB and -12 dB.
### Key Observations
* The "Desired" and "Proposed" methods exhibit a stable amplitude response across the frequency range.
* The "PM" method shows a significant dip in amplitude response between 2000 Hz and 6000 Hz, indicating a potential issue in this frequency range.
### Interpretation
The chart compares the amplitude response of three methods ("Desired", "Proposed", and "PM") across a range of frequencies. The "Desired" and "Proposed" methods maintain a consistent amplitude response, suggesting stable performance across the frequency spectrum. In contrast, the "PM" method experiences a significant drop in amplitude response within the 2000-6000 Hz range, indicating a potential weakness or filter characteristic in this frequency band. The "Proposed" method closely matches the "Desired" response, suggesting it is a good alternative. The "PM" method deviates significantly, especially in the 2000-6000 Hz range.