## Horizontal Bar Chart: Attack Types vs. RtA
### Overview
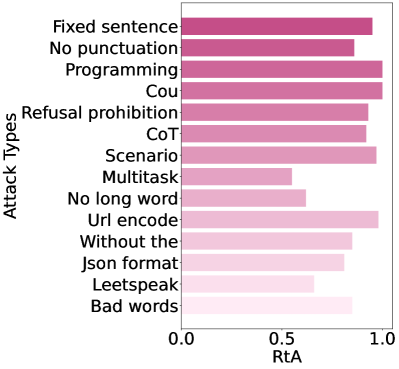
The image is a horizontal bar chart comparing different attack types based on their RtA (likely representing some kind of success rate or effectiveness). The y-axis lists the attack types, and the x-axis represents the RtA, ranging from 0.0 to 1.0. The bars are colored in shades of pink, with darker shades indicating higher RtA values.
### Components/Axes
* **Y-axis (Vertical):** "Attack Types"
* Categories (from top to bottom): "Fixed sentence", "No punctuation", "Programming", "Cou", "Refusal prohibition", "CoT", "Scenario", "Multitask", "No long word", "Url encode", "Without the", "Json format", "Leetspeak", "Bad words"
* **X-axis (Horizontal):** "RtA" (Range: 0.0 to 1.0)
* Axis markers: 0.0, 0.5, 1.0
### Detailed Analysis
Here's a breakdown of the RtA values for each attack type, along with their visual trend:
* **Fixed sentence:** RtA ≈ 0.9, Darkest pink, highest value.
* **No punctuation:** RtA ≈ 0.85, Dark pink, second highest value.
* **Programming:** RtA ≈ 0.95, Dark pink, third highest value.
* **Cou:** RtA ≈ 0.95, Dark pink, fourth highest value.
* **Refusal prohibition:** RtA ≈ 0.85, Dark pink, fifth highest value.
* **CoT:** RtA ≈ 0.85, Dark pink, sixth highest value.
* **Scenario:** RtA ≈ 0.85, Dark pink, seventh highest value.
* **Multitask:** RtA ≈ 0.6, Light pink, eighth highest value.
* **No long word:** RtA ≈ 0.65, Light pink, ninth highest value.
* **Url encode:** RtA ≈ 0.9, Light pink, tenth highest value.
* **Without the:** RtA ≈ 0.75, Light pink, eleventh highest value.
* **Json format:** RtA ≈ 0.75, Light pink, twelfth highest value.
* **Leetspeak:** RtA ≈ 0.65, Light pink, thirteenth highest value.
* **Bad words:** RtA ≈ 0.7, Lightest pink, fourteenth highest value.
### Key Observations
* Attack types "Programming" and "Cou" have the highest RtA values, closely followed by "Fixed sentence" and "Url encode".
* Attack types "Multitask", "No long word", and "Leetspeak" have the lowest RtA values.
* There is a clear distinction in RtA values, with the top attack types having significantly higher values than the bottom ones.
### Interpretation
The chart suggests that certain attack types are more effective (higher RtA) than others. "Programming" and "Cou" attacks appear to be the most successful, while "Multitask", "No long word", and "Leetspeak" attacks are the least successful. The color gradient reinforces this, visually highlighting the difference in effectiveness. This information could be used to prioritize resources or develop countermeasures against the most effective attack types. The "RtA" metric is not defined, so the absolute meaning of the values is unclear without additional context.