## Bar Chart: Attack Types vs. RtA
### Overview
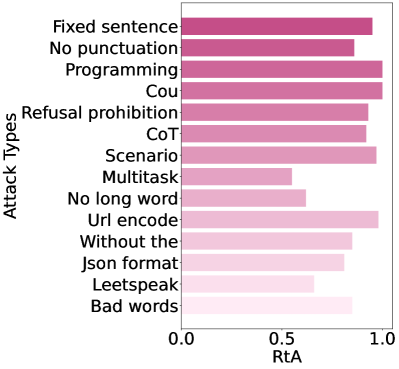
This is a horizontal bar chart comparing the "RtA" (likely Response to Attack or similar metric) across different "Attack Types". The bars represent the RtA value for each attack type, with higher values indicating a stronger response or resistance to the attack.
### Components/Axes
* **Y-Axis (Vertical):** "Attack Types" - Lists the different types of attacks being evaluated. The categories are:
* Fixed sentence
* No punctuation
* Programming
* Cou (Incomplete label, likely "Count" or similar)
* Refusal prohibition
* CoT (Likely "Chain of Thought")
* Scenario
* Multitask
* No long word
* Url encode
* Without the
* Json format
* Leetspeak
* Bad words
* **X-Axis (Horizontal):** "RtA" - Represents the response to attack metric, ranging from 0.0 to 1.0.
* **Bars:** Horizontal bars representing the RtA value for each attack type. All bars are the same color (a shade of pink/purple).
### Detailed Analysis
The bars are arranged vertically, with "Fixed sentence" at the top and "Bad words" at the bottom. I will describe the trend and approximate the RtA value for each attack type, reading from top to bottom.
* **Fixed sentence:** The bar extends almost to the 1.0 mark. Approximate RtA: 0.95 ± 0.02
* **No punctuation:** The bar is slightly shorter than "Fixed sentence". Approximate RtA: 0.85 ± 0.02
* **Programming:** The bar is similar in length to "No punctuation". Approximate RtA: 0.83 ± 0.02
* **Cou:** The bar is slightly shorter than "Programming". Approximate RtA: 0.78 ± 0.02
* **Refusal prohibition:** The bar is similar in length to "Cou". Approximate RtA: 0.75 ± 0.02
* **CoT:** The bar is slightly shorter than "Refusal prohibition". Approximate RtA: 0.70 ± 0.02
* **Scenario:** The bar is similar in length to "CoT". Approximate RtA: 0.68 ± 0.02
* **Multitask:** The bar is shorter than "Scenario". Approximate RtA: 0.60 ± 0.02
* **No long word:** The bar is similar in length to "Multitask". Approximate RtA: 0.58 ± 0.02
* **Url encode:** The bar is slightly shorter than "No long word". Approximate RtA: 0.55 ± 0.02
* **Without the:** The bar is similar in length to "Url encode". Approximate RtA: 0.53 ± 0.02
* **Json format:** The bar is slightly shorter than "Without the". Approximate RtA: 0.48 ± 0.02
* **Leetspeak:** The bar is similar in length to "Json format". Approximate RtA: 0.45 ± 0.02
* **Bad words:** The bar is the shortest, extending to approximately the 0.4 mark. Approximate RtA: 0.40 ± 0.02
### Key Observations
* "Fixed sentence" has the highest RtA, indicating the strongest response to this type of attack.
* "Bad words" has the lowest RtA, indicating the weakest response.
* The RtA values generally decrease as you move down the list of attack types.
* There is a relatively consistent spread of RtA values between 0.4 and 0.9.
### Interpretation
The chart demonstrates the effectiveness of a system (likely a language model or security filter) in responding to different types of attacks. The "RtA" metric likely represents the system's ability to detect, mitigate, or reject these attacks. The fact that "Fixed sentence" is most effectively handled suggests the system is robust against simple, straightforward attacks. Conversely, the lower RtA for "Bad words" suggests the system may struggle with attacks that rely on offensive or inappropriate language. The incomplete label "Cou" is a data quality issue that should be investigated. The chart provides valuable insights into the system's vulnerabilities and can guide further development and improvement efforts. The consistent color of the bars suggests that the chart is not intended to highlight differences *within* the RtA values, but rather to compare the RtA values *between* the different attack types.