## Bar Chart: Attack Types vs. RtA Values
### Overview
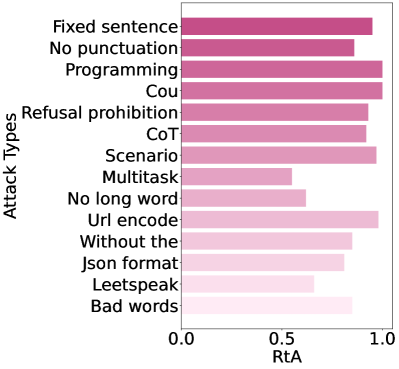
The image is a horizontal bar chart comparing the "RtA" (likely "Robustness to Attack" or similar metric) values across 13 different attack types. The y-axis lists attack types, while the x-axis represents RtA values ranging from 0.0 to 1.0. Bars are color-coded from dark purple (high RtA) to light pink (low RtA), with no explicit legend present.
### Components/Axes
- **Y-Axis (Attack Types)**:
- Categories listed from top to bottom:
1. Fixed sentence
2. No punctuation
3. Programming
4. Cou
5. Refusal prohibition
6. CoT
7. Scenario
8. Multitask
9. No long word
10. Url encode
11. Without the
12. Json format
13. Leetspeak
14. Bad words
- **X-Axis (RtA)**:
- Scale from 0.0 (left) to 1.0 (right), with no intermediate markers.
- **Bars**:
- Horizontal bars represent RtA values for each attack type.
- Color gradient: Dark purple (highest RtA) to light pink (lowest RtA).
### Detailed Analysis
- **Highest RtA Values (~0.95)**:
- Programming, Cou, Url encode (darkest purple).
- **Moderate-High RtA (~0.85–0.92)**:
- Fixed sentence (~0.92), Scenario (~0.92), Refusal prohibition (~0.90), CoT (~0.88), No punctuation (~0.88), Without the (~0.85), Bad words (~0.85).
- **Moderate RtA (~0.83)**:
- Json format.
- **Lowest RtA (~0.55–0.60)**:
- Multitask (~0.55), No long word (~0.60), Leetspeak (~0.60).
### Key Observations
1. **Dominance of High RtA Attack Types**:
- Programming, Cou, and Url encode consistently show the highest RtA values (~0.95), suggesting they are the most effective or prevalent.
2. **Cluster of Moderate Values**:
- Most attack types fall within 0.83–0.92, indicating a common range of effectiveness.
3. **Low-Performing Attack Types**:
- Multitask (~0.55), No long word (~0.60), and Leetspeak (~0.60) have significantly lower RtA values, implying reduced efficacy.
4. **Color Correlation**:
- Darker bars (top of the y-axis) align with higher RtA values, while lighter bars (bottom) correspond to lower values.
### Interpretation
The chart highlights that certain attack strategies (e.g., Programming, Cou, Url encode) are disproportionately effective, potentially due to their technical sophistication or exploitation of system vulnerabilities. In contrast, simpler or less targeted methods (e.g., Multitask, Leetspeak) underperform. The color gradient visually reinforces this hierarchy, making it easier to identify critical attack vectors. This data could guide prioritization of defensive measures, focusing on mitigating high-RtA threats first. The absence of a legend complicates direct interpretation of color meaning, but the gradient’s alignment with RtA values suggests an intentional design choice to emphasize magnitude.