## Line Chart: Model Accuracy vs. Sample Size
### Overview
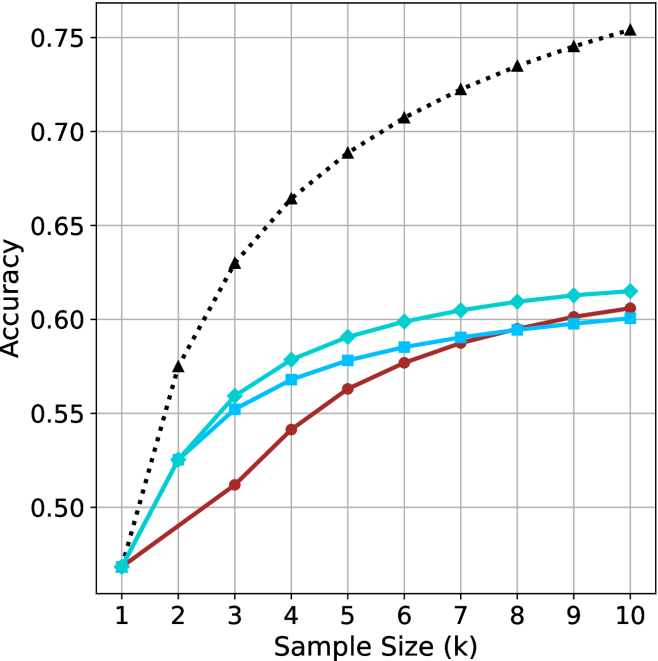
The chart compares the accuracy of three machine learning models (Baseline, Ensemble, Hybrid) across sample sizes from 1 to 10. A dotted reference line illustrates an idealized accuracy trajectory. All models show improvement with increasing sample size, but with distinct performance patterns.
### Components/Axes
- **X-axis**: Sample Size (k) [1–10]
- Ticks labeled 1, 2, 3, ..., 10
- No explicit units, but labeled "Sample Size (k)"
- **Y-axis**: Accuracy [0.45–0.75]
- Increments of 0.05
- Labeled "Accuracy"
- **Legend**: Right-aligned
- Cyan: "Baseline Model"
- Blue: "Ensemble Model"
- Red: "Hybrid Model"
- **Dotted Line**: Unlabeled reference trajectory
### Detailed Analysis
1. **Baseline Model (Cyan)**
- Starts at (1, 0.45)
- Steady upward trend:
- (2, 0.52), (3, 0.56), (4, 0.58), (5, 0.60)
- Plateaus at ~0.61 from k=6 to k=10
- Final accuracy: 0.61
2. **Ensemble Model (Blue)**
- Starts at (2, 0.55)
- Gradual increase:
- (3, 0.57), (4, 0.58), (5, 0.59)
- Reaches 0.60 at k=6, plateaus thereafter
- Final accuracy: 0.60
3. **Hybrid Model (Red)**
- Starts at (1, 0.45)
- Slower rise:
- (2, 0.48), (3, 0.52), (4, 0.54)
- Accelerates slightly: (5, 0.56), (6, 0.58)
- Stabilizes at 0.60 from k=8 onward
- Final accuracy: 0.60
4. **Dotted Reference Line**
- Starts at (1, 0.45)
- Curved upward trajectory:
- (2, 0.55), (3, 0.60), (4, 0.63)
- Reaches 0.75 at k=10
- Suggests theoretical maximum or ideal performance
### Key Observations
- **Diminishing Returns**: All models plateau after k=6–8, indicating limited gains from larger samples.
- **Baseline Model Outperforms**: Despite starting later, the Ensemble Model (blue) lags behind Baseline (cyan) at k=10.
- **Hybrid Model Lag**: The Hybrid Model (red) shows the slowest initial improvement but matches Baseline by k=10.
- **Dotted Line Discrepancy**: The reference line’s accuracy (0.75 at k=10) exceeds all models, suggesting unmet potential.
### Interpretation
The data demonstrates that increasing sample size improves model accuracy, but with diminishing returns. The Baseline Model achieves the highest final accuracy (0.61), while the Ensemble Model underperforms despite starting earlier. The Hybrid Model’s delayed improvement suggests architectural or training inefficiencies. The dotted line’s trajectory implies that current models fall short of an idealized performance ceiling, highlighting opportunities for algorithmic innovation or data augmentation. The absence of a labeled dotted line leaves its purpose ambiguous—it could represent a theoretical benchmark, a competitor’s result, or an aspirational target.