# Technical Document Extraction: Flowchart Analysis
## 1. **Component Identification**
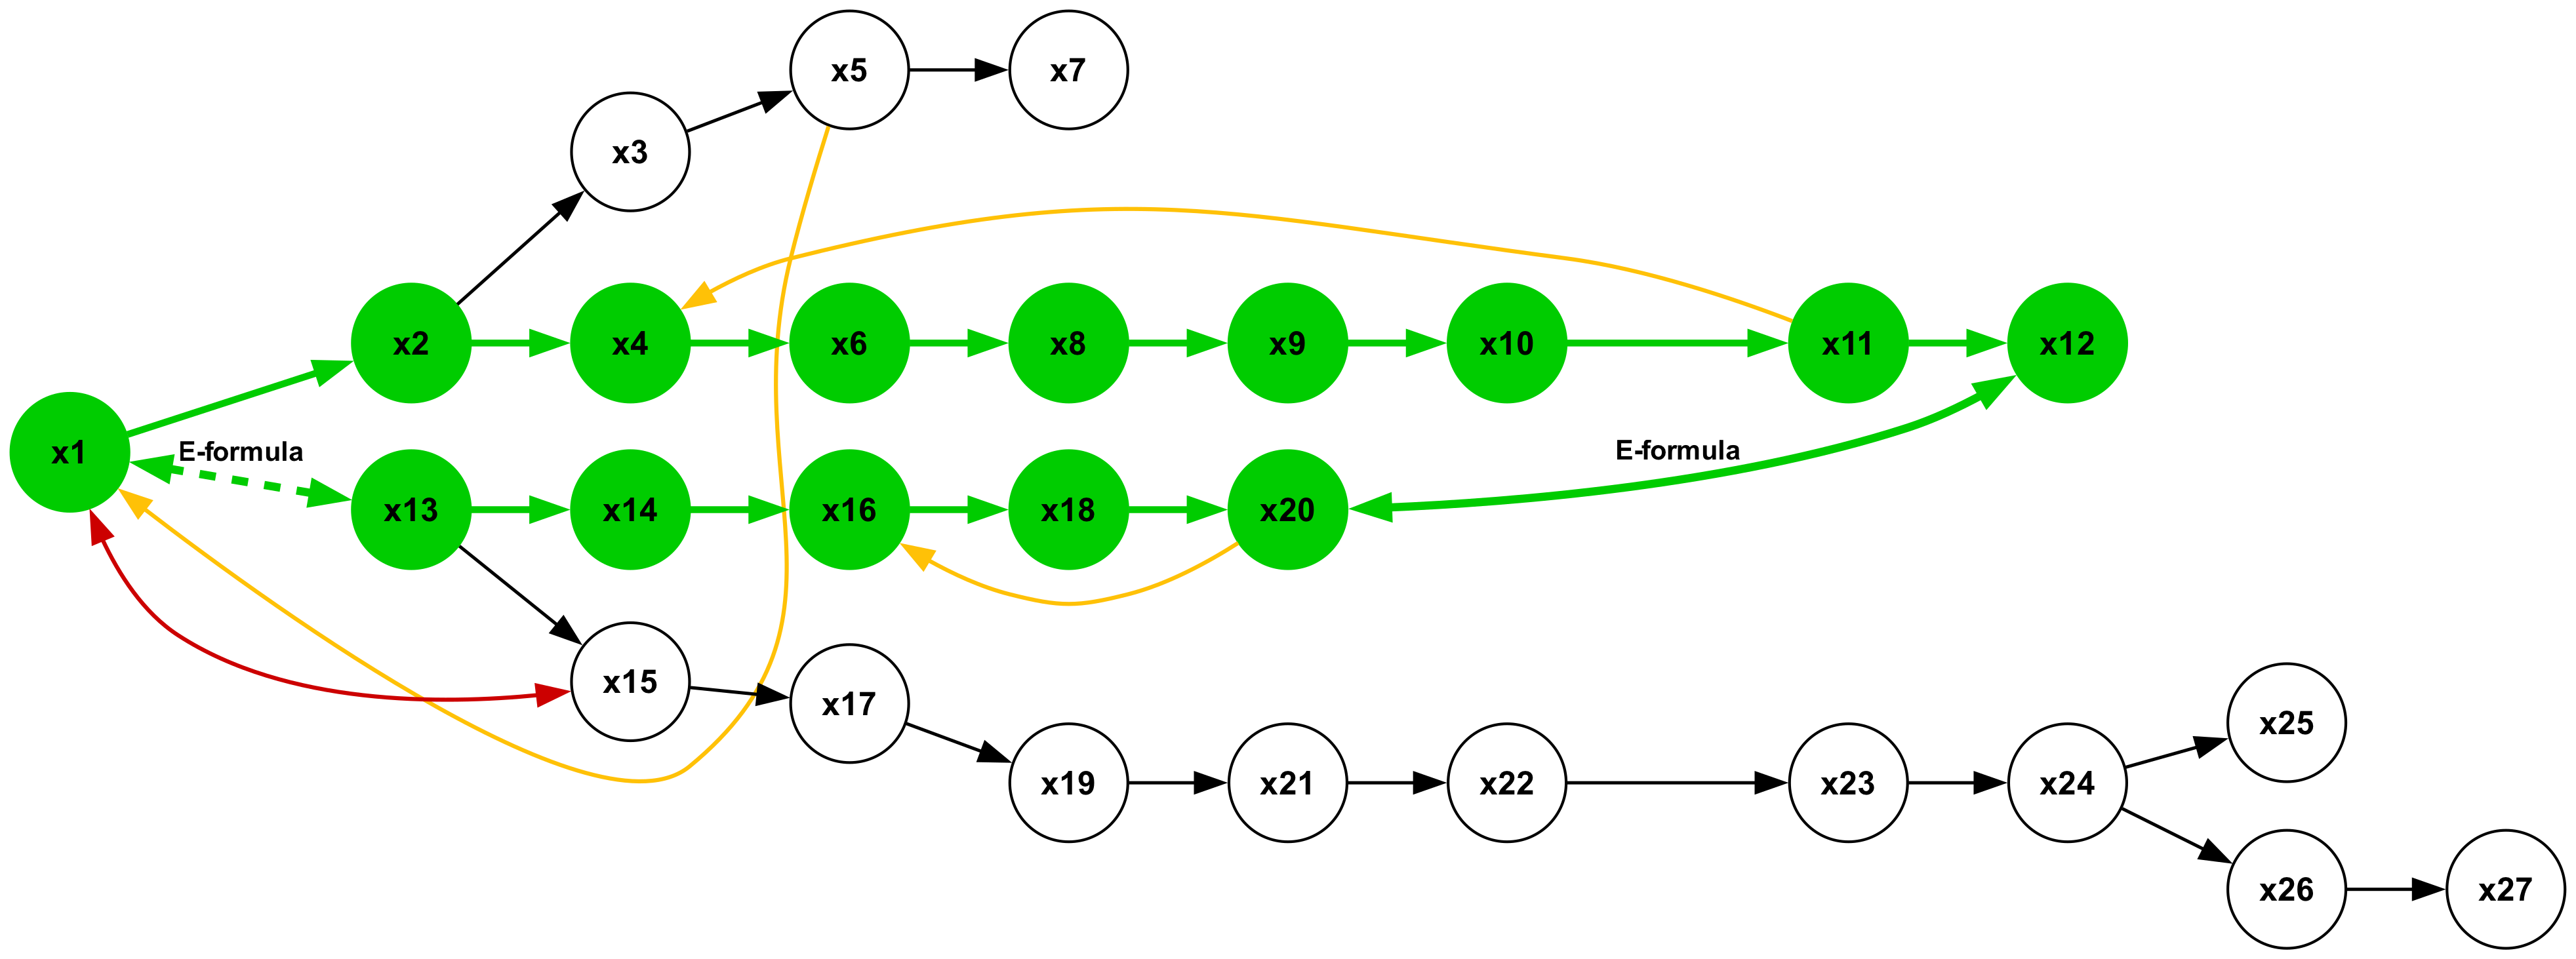
The image depicts a **directed graph** (flowchart) with **27 nodes** labeled `x1` to `x27`. Nodes are categorized by **color**:
- **Green nodes**: `x1`, `x2`, `x4`, `x6`, `x8`, `x9`, `x10`, `x11`, `x12`, `x13`, `x14`, `x16`, `x18`, `x20`, `x23`, `x24`, `x25`, `x26`, `x27`
- **Black nodes**: `x3`, `x5`, `x7`, `x15`, `x17`, `x19`, `x21`, `x22`
- **White nodes**: `x15`, `x17`, `x19`, `x21`, `x22`, `x23`, `x24`, `x25`, `x26`, `x27` (overlapping with black nodes in some cases)
**Arrows**:
- **Green arrows**: Connect green nodes (e.g., `x1 → x2`, `x2 → x4`, `x4 → x6`, etc.)
- **Yellow arrows**: Connect green nodes to black/white nodes (e.g., `x1 → x13`, `x13 → x15`, `x16 → x17`)
- **Red arrows**: Connect white nodes (e.g., `x15 → x17`, `x17 → x19`)
- **Black arrows**: Connect black nodes (e.g., `x3 → x5`, `x5 → x7`, `x15 → x17`, `x19 → x21`, `x21 → x22`, `x23 → x24`, `x24 → x25`, `x25 → x26`, `x26 → x27`)
**Labels**:
- **"E-formula"**: Annotated on two green arrows (`x1 → x13` and `x11 → x12`).
---
## 2. **Flowchart Structure**
### **Main Chain (Green Nodes)**
- **Primary Path**: `x1 → x2 → x4 → x6 → x8 → x9 → x10 → x11 → x12`
- **Branches**:
- `x1 → x13 → x14 → x16 → x18 → x20 → x23 → x24 → x25 → x26 → x27`
- `x13 → x15 → x17 → x19 → x21 → x22`
### **Black Node Subgraph**
- **Chain**: `x3 → x5 → x7`
- **Connections to Main Chain**:
- `x3` and `x5` are connected to `x1` via **yellow arrows**.
- `x7` is isolated (no outgoing arrows).
### **White Node Subgraph**
- **Chain**: `x15 → x17 → x19 → x21 → x22`
- **Connections**:
- `x15` and `x17` are connected to `x13` and `x16` via **yellow arrows**.
- `x23` and `x24` are connected to `x12` via **green arrows**.
---
## 3. **Key Trends and Data Points**
- **Green Arrows**: Represent the **main workflow** (e.g., `x1 → x2 → x4 → ... → x12`).
- **Yellow Arrows**: Indicate **branching or conditional paths** (e.g., `x1 → x13`, `x16 → x17`).
- **Red Arrows**: Highlight **alternative or error paths** (e.g., `x15 → x17`).
- **Black Arrows**: Represent **subprocesses** (e.g., `x3 → x5 → x7`).
---
## 4. **Legend and Color Coding**
- **No explicit legend** is present in the image. However, the **color coding** of nodes and arrows likely signifies:
- **Green**: Primary process nodes.
- **Black**: Subprocess or intermediate nodes.
- **White**: Specialized or error nodes.
- **Arrow colors**: Differentiate connection types (e.g., green for standard flow, yellow for branching, red for errors).
---
## 5. **Spatial Grounding**
- **Nodes**: Arranged in a **networked layout** with no strict grid alignment.
- **Arrows**: Directed from source to target, with **color-coded paths** for visual distinction.
- **Labels**: Positioned **above or below nodes** (e.g., `x1`, `x2`, etc.).
---
## 6. **Textual Information**
- **Node Labels**: `x1`, `x2`, ..., `x27` (all in English).
- **Arrow Labels**: `"E-formula"` (English).
---
## 7. **Missing Elements**
- **No axis titles, legends, or data tables** are present.
- **No numerical data** is embedded in the diagram.
---
## 8. **Summary**
The flowchart represents a **multi-path process** with:
1. A **primary workflow** (green nodes and arrows).
2. **Branching paths** (yellow arrows).
3. **Subprocesses** (black nodes and arrows).
4. **Error or alternative paths** (red arrows and white nodes).
The **"E-formula"** label suggests a specific operation or rule applied at critical points (`x1 → x13` and `x11 → x12`).
---
## 9. **Conclusion**
This diagram illustrates a **complex decision-making or computational process** with multiple interdependent steps. The use of color-coded arrows and nodes helps distinguish between different types of operations or states. Further analysis would require additional context (e.g., definitions of "E-formula" or node functions).