## Diagram: Flowchart of Processes
### Overview
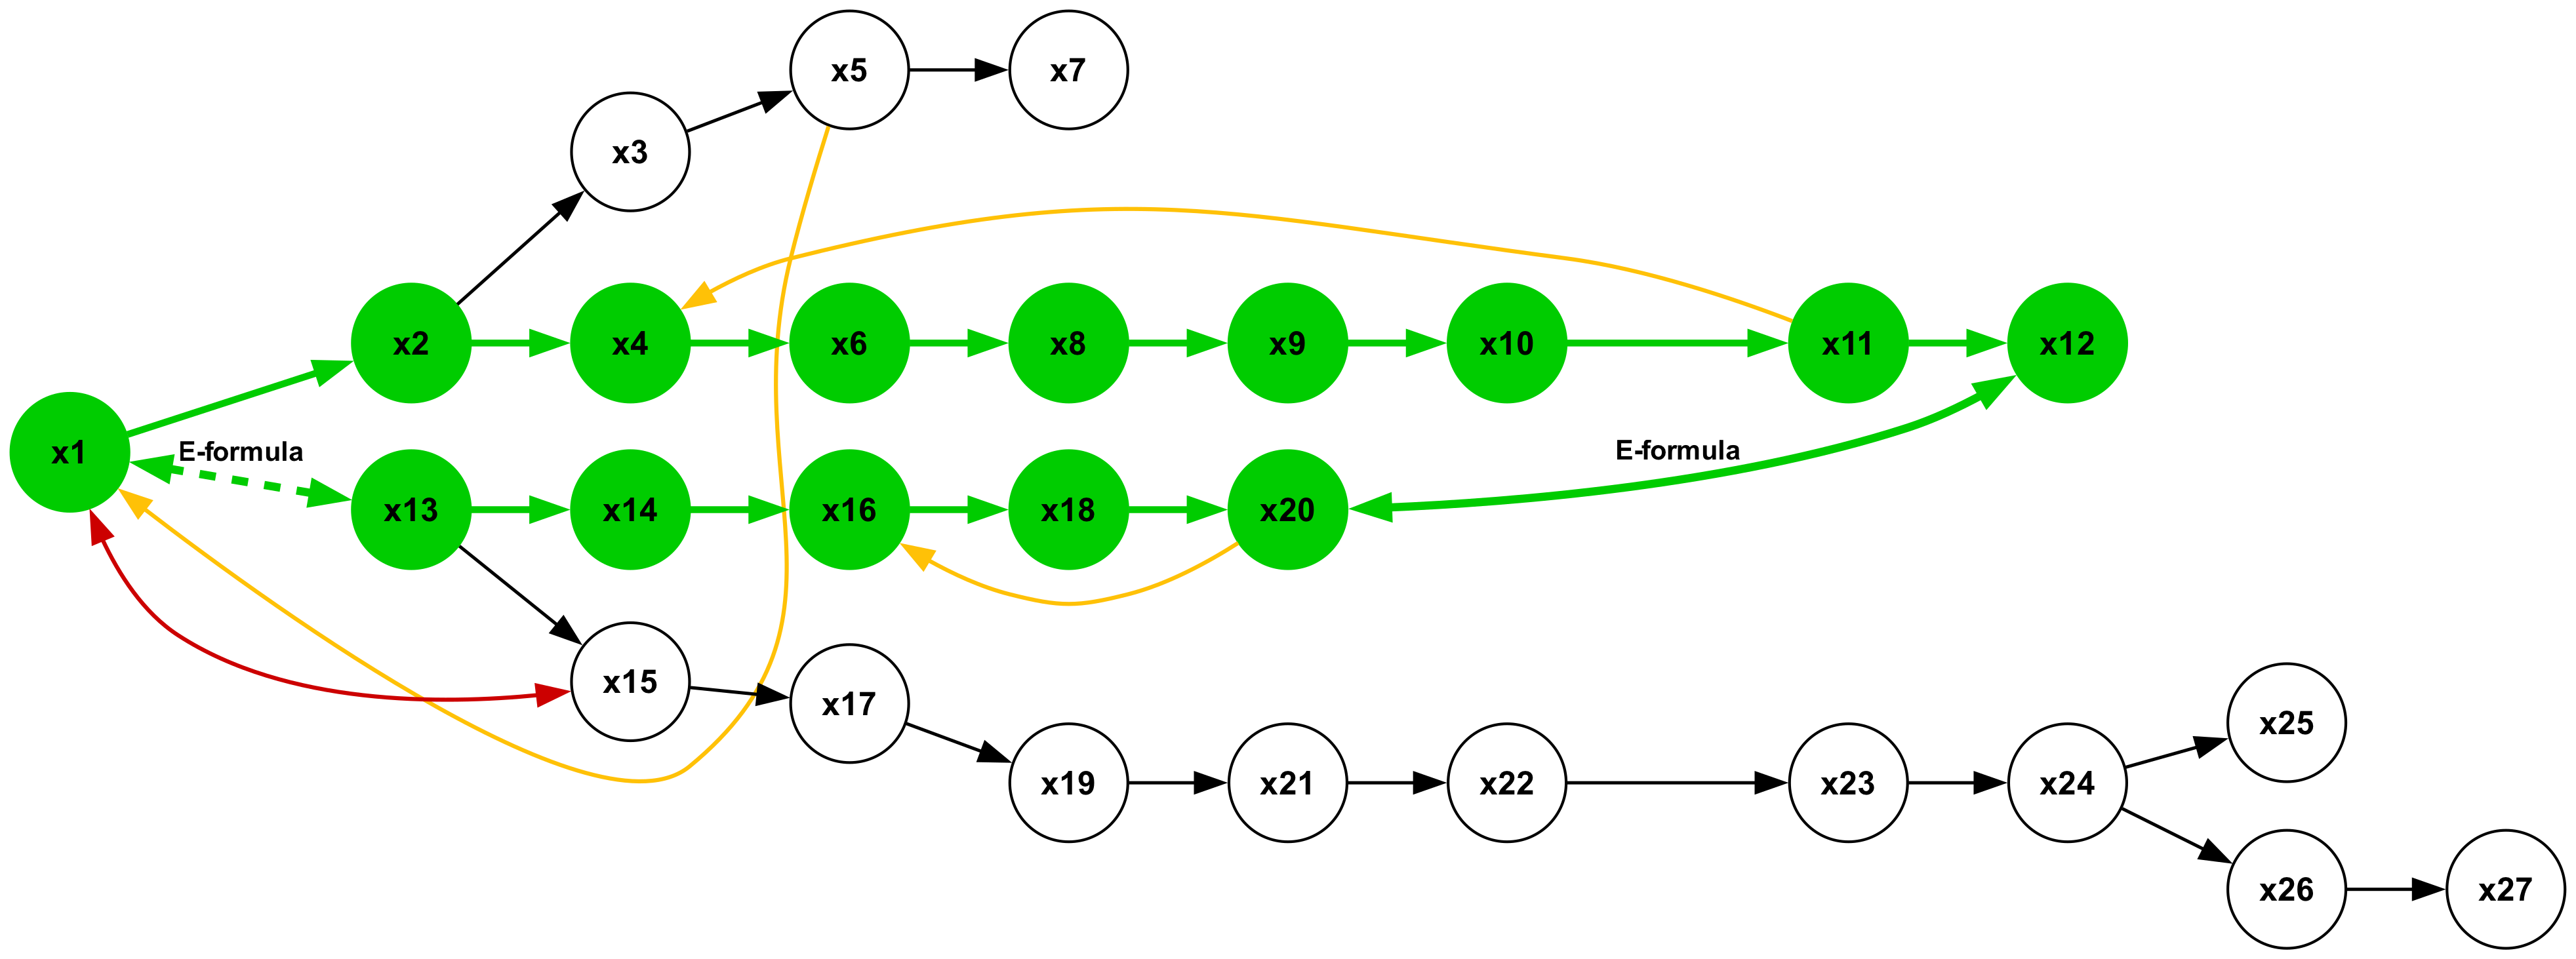
The image is a flowchart depicting a series of processes or steps, represented by circles labeled x1 through x27. The flow is indicated by arrows connecting the circles. The circles are either green or white, and the arrows are green, black, red, or yellow, suggesting different types of transitions or relationships between the processes.
### Components/Axes
* **Nodes:** Circles labeled x1 to x27, representing individual processes or states.
* Green nodes: x1, x2, x4, x6, x8, x9, x10, x11, x12, x13, x14, x16, x18, x20
* White nodes: x3, x5, x7, x15, x17, x19, x21, x22, x23, x24, x25, x26, x27
* **Edges:** Arrows indicating the flow or relationship between nodes.
* Green arrows: Represent a standard flow or process.
* Black arrows: Represent a standard flow or process.
* Red arrow: Represents a specific type of flow or relationship.
* Yellow arrows: Represent a specific type of flow or relationship.
* **Labels:** "E-formula" appears twice, indicating a specific type of transition or process step.
### Detailed Analysis
* **Starting Point:** The flow originates from node x1 (green).
* **Branching:**
* From x1, there are two green arrows leading to x2 and x13. There is also a dashed green arrow labeled "E-formula" leading to x13.
* From x3, there is a black arrow leading to x5.
* From x4, there is a black arrow leading to x5.
* From x4, there is a green arrow leading to x6.
* From x15, there is a black arrow leading to x17.
* From x17, there is a black arrow leading to x19.
* From x24, there are two black arrows leading to x25 and x26.
* From x26, there is a black arrow leading to x27.
* **Parallel Paths:** Two main parallel paths originate from x1:
* x1 -> x2 -> x4 -> x6 -> x8 -> x9 -> x10 -> x11 -> x12
* x1 -> x13 -> x14 -> x16 -> x18 -> x20 -> x12
* **Feedback Loops:**
* A red arrow goes from x15 to x1.
* A yellow arrow goes from x6 to x15.
* A yellow arrow goes from x8 to x11.
* A yellow arrow goes from x16 to x17.
* A yellow arrow goes from x18 to x11.
* **Ending Point:** Both main paths converge at node x12 (green).
* **Isolated Path:** A separate path starts from x3 (white) and goes to x5 (white) and then to x7 (white).
* **Bottom Path:** A path starts from x15 (white) and goes to x17 (white), x19 (white), x21 (white), x22 (white), x23 (white), x24 (white), and then splits into two paths leading to x25 (white), x26 (white), and x27 (white).
### Key Observations
* The diagram illustrates a process flow with multiple parallel paths and feedback loops.
* Green nodes and arrows likely represent the main or desired flow, while white nodes and other colored arrows indicate alternative or less common paths.
* The "E-formula" labels suggest specific calculations or transformations occur at those points.
* The red arrow from x15 to x1 indicates a critical feedback loop, potentially representing a reset or error condition.
### Interpretation
The flowchart likely represents a complex system or process with multiple stages and decision points. The green path could represent the optimal or standard flow, while the white nodes and other colored arrows indicate alternative paths or exceptions. The feedback loops suggest mechanisms for error correction or adaptation. The "E-formula" labels indicate that specific calculations or transformations are applied at certain stages. The diagram could be used to analyze the efficiency and robustness of the system, identify potential bottlenecks or failure points, and optimize the overall process flow.