\n
## Diagram: Process Flow with Variable Nodes
### Overview
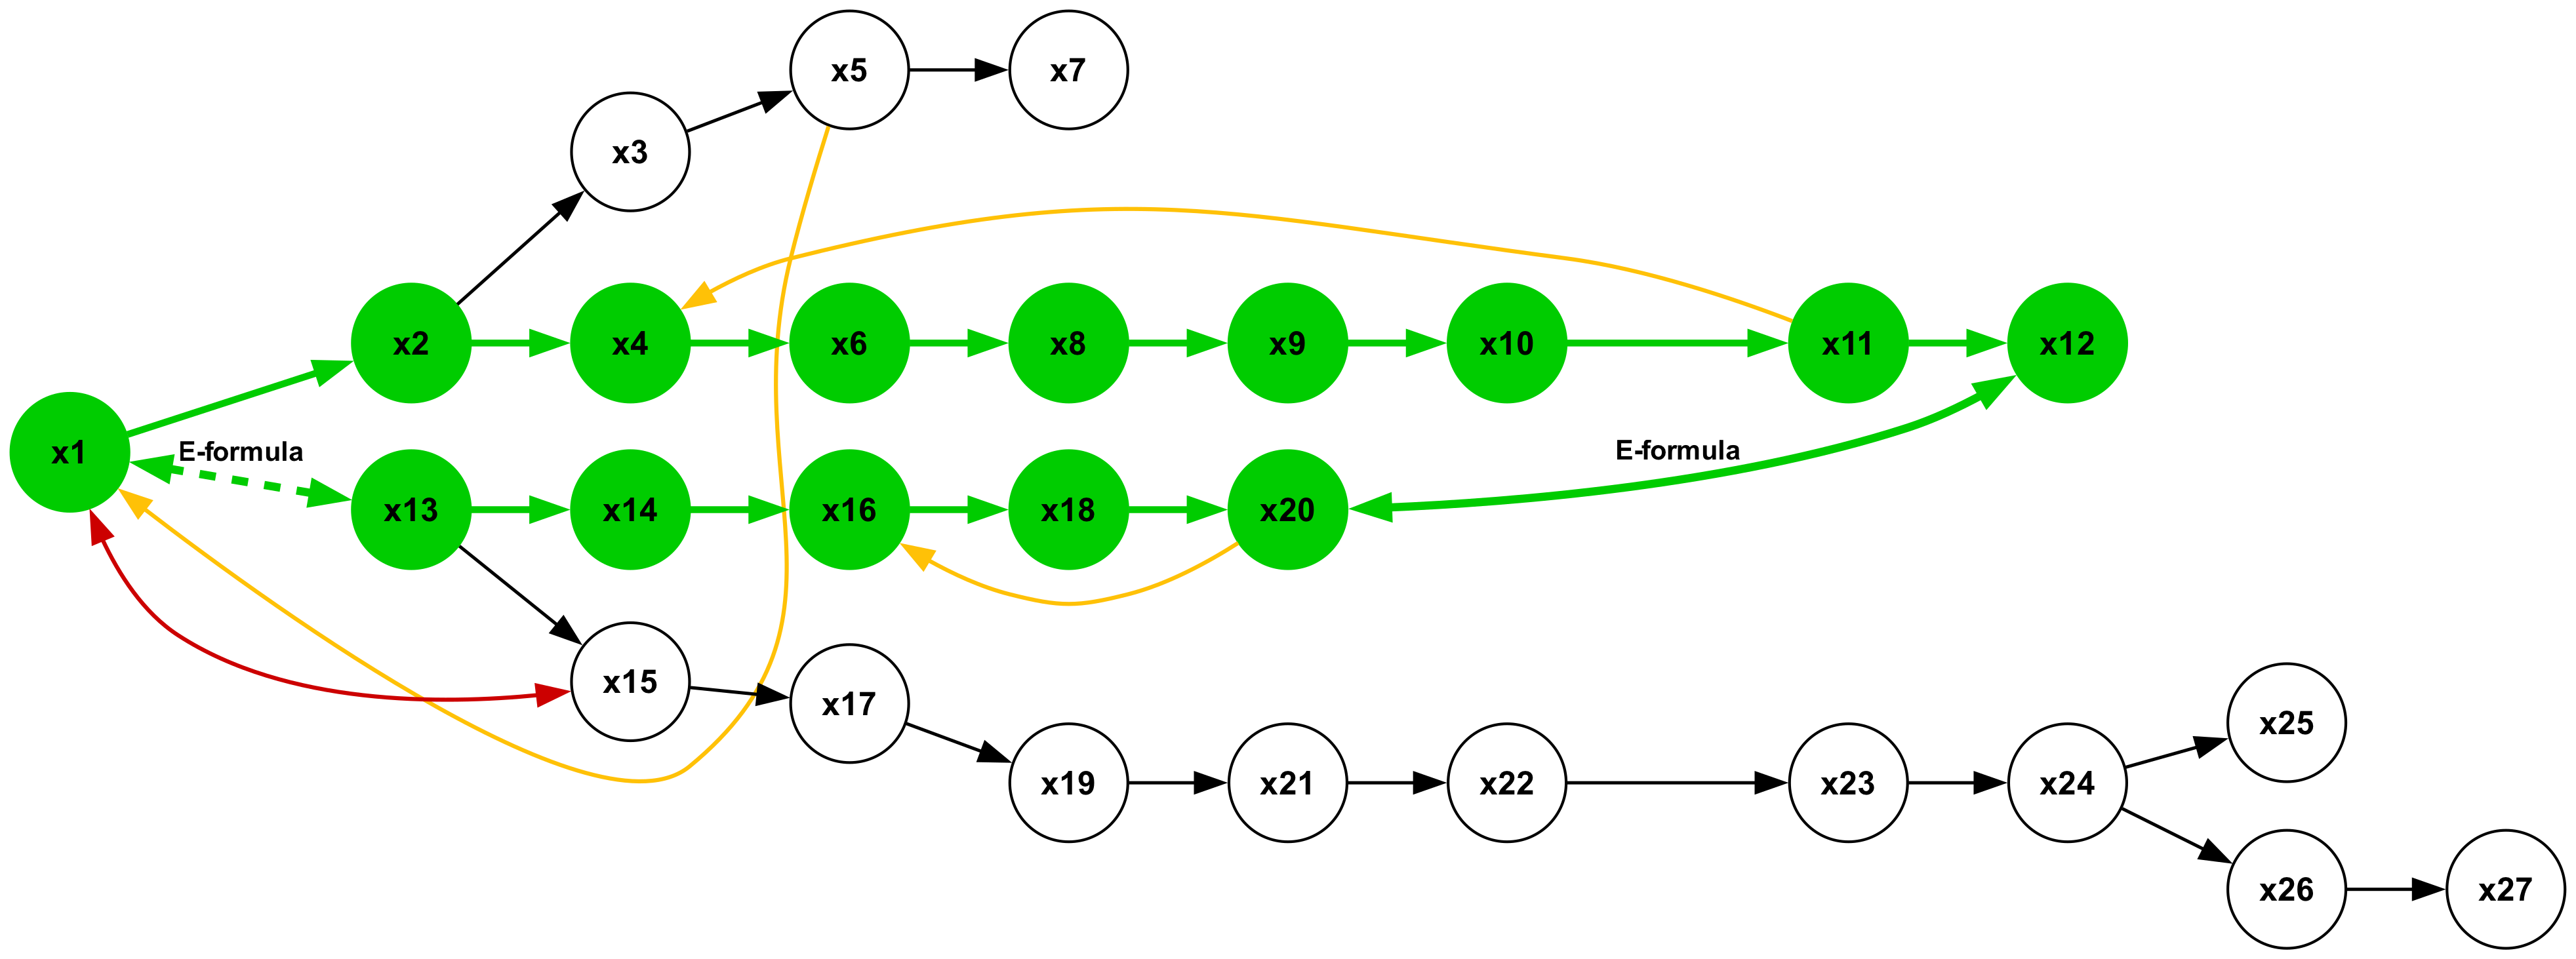
The image depicts a directed graph representing a process flow. The nodes are labeled "x1" through "x27", and are connected by arrows indicating the direction of flow. Some nodes are green, while others are white. The diagram includes two instances of the label "E-formula" associated with edges.
### Components/Axes
The diagram consists of:
* **Nodes:** 27 circular nodes labeled x1 to x27.
* **Edges:** Directed arrows connecting the nodes, representing the flow of the process.
* **Node Color:** Green and White.
* **Labels:** "x1" through "x27", "E-formula" (appears twice).
### Detailed Analysis or Content Details
The diagram can be broken down into several paths:
* **Path 1:** x1 -> x2 -> x4 -> x6 -> x8 -> x9 -> x10 -> x11 -> x12
* **Path 2:** x1 -> x2 -> x13 -> x14 -> x16 -> x18 -> x20 -> x11 -> x12
* **Path 3:** x1 -> x15 -> x17 -> x19 -> x21 -> x22 -> x23 -> x24 -> x25
* **Path 4:** x1 -> x15 -> x17 -> x19 -> x21 -> x22 -> x23 -> x24 -> x26 -> x27
* **Path 5:** x3 -> x5 -> x7
* **Path 6:** x3 -> x4 -> x6 -> x8 -> x9 -> x10 -> x11 -> x12
The edges x1->x2 and x20->x11 are labeled "E-formula".
All nodes except x3, x5, x7, x15, x17, x19, x25, x26, and x27 are colored green.
### Key Observations
* The diagram shows a branching process, starting from x1 and x3.
* Multiple paths converge at node x11.
* The "E-formula" label appears on edges originating from x1 and x20, suggesting a specific calculation or transformation is applied at those points.
* The white nodes appear to be intermediate or auxiliary nodes, while the green nodes represent core process steps.
* The diagram is not a simple linear flow; it contains loops and parallel paths.
### Interpretation
The diagram likely represents a workflow or a computational process. The nodes represent states or variables, and the edges represent transitions or operations. The "E-formula" label suggests that a specific equation or algorithm is applied at those points in the process. The branching paths indicate that the process can take different routes depending on certain conditions or inputs. The color coding may indicate the status or type of each node (e.g., green for completed steps, white for pending steps). The diagram suggests a complex system with multiple interconnected components. The convergence at x11 and x12 suggests a final stage where results from different branches are combined. The diagram does not provide any quantitative data, but it offers a clear visual representation of the process flow and its key elements.