## Diagram: Staircase Approximation of a Curve
### Overview
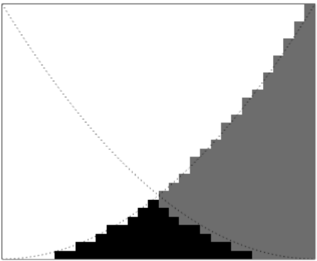
The image shows a square diagram with a curve approximated by two sets of staircases. One staircase is black and located near the bottom, while the other is gray and located near the top-right corner. A dotted line represents the curve being approximated.
### Components/Axes
* **Axes:** The diagram is a square, implying equal scales on both axes, though no explicit labels are provided. The axes range from 0 to 1 implicitly.
* **Curve:** A dotted line represents the curve being approximated. It starts at the top-left corner and curves downwards to the bottom-right corner.
* **Black Staircase:** A black staircase pattern approximates the curve from below, near the bottom of the square.
* **Gray Staircase:** A gray staircase pattern approximates the curve from above, near the top-right corner of the square.
### Detailed Analysis
* **Curve Approximation:** The staircases provide a visual representation of approximating the area under the curve. The black staircase represents an underestimation, while the gray staircase represents an overestimation.
* **Staircase Steps:** The steps of the staircases are uniform in size.
* **Positioning:** The black staircase is positioned at the bottom of the square, while the gray staircase is positioned at the top-right corner.
### Key Observations
* The dotted line is a curve that starts at the top-left corner and ends at the bottom-right corner.
* The black staircase is below the curve, and the gray staircase is above the curve.
* The staircases provide a visual representation of approximating the area under the curve.
### Interpretation
The diagram illustrates the concept of approximating the area under a curve using step functions (staircases). The black staircase represents a lower bound (underestimation), while the gray staircase represents an upper bound (overestimation) of the true area under the curve. This is a visual representation of the concept of integration using Riemann sums. The dotted line represents the function being integrated. The diagram demonstrates how finer steps in the staircase would lead to a more accurate approximation of the area under the curve.