## Diagram: Threshold Boundary with Staircase Pattern
### Overview
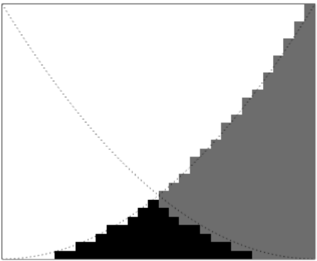
The image depicts a black-and-white technical diagram with no textual labels, legends, or axis markers. It features a diagonal dotted line (dashed curve) dividing the image into two triangular regions: a black lower-left triangle and a gray upper-right triangle. The gray region contains a staircase-like pattern, while the black region is solid. The dotted line appears to act as a boundary or threshold between the two areas.
### Components/Axes
- **Diagonal Dotted Line**: A dashed curve running from the top-left corner to the bottom-right corner, dividing the image into two regions.
- **Lower-Left Triangle**: Solid black fill, occupying the area below the dotted line.
- **Upper-Right Triangle**: Gray fill with a staircase-like pattern, occupying the area above the dotted line.
- **Staircase Pattern**: A series of horizontal and vertical steps in the gray region, suggesting a stepwise progression or classification.
### Detailed Analysis
- **Dotted Line**: The dashed curve is centrally positioned, creating a clear division between the black and gray regions. Its placement suggests a boundary or decision threshold.
- **Staircase Pattern**: The steps in the gray region are evenly spaced and increase in height from left to right, indicating a progressive or cumulative effect.
- **Color Contrast**: The black and gray regions are sharply differentiated, emphasizing the separation between the two zones.
### Key Observations
- No textual labels, axis titles, or legends are present in the image.
- The staircase pattern in the gray region is the only visual element with a structured progression.
- The dotted line’s curvature and placement imply a non-linear threshold or classification boundary.
### Interpretation
The diagram likely represents a conceptual or mathematical boundary, such as a decision threshold in a classification problem, a phase transition in a physical system, or a stepwise progression in a process. The absence of labels or numerical data limits direct interpretation, but the visual elements suggest:
1. **Threshold Dynamics**: The dotted line may represent a critical value or condition separating two states (e.g., "above" vs. "below" a certain parameter).
2. **Staircase Progression**: The gray region’s steps could symbolize incremental steps in a process, such as stages in a workflow, levels in a hierarchy, or discrete intervals in a dataset.
3. **Binary Classification**: The black and gray regions might represent two distinct categories (e.g., "included" vs. "excluded," "active" vs. "inactive").
The diagram’s simplicity and lack of textual context suggest it is a schematic representation meant to illustrate a conceptual relationship rather than a data-driven chart. Further clarification on the context (e.g., domain, purpose) would enhance interpretability.