# Technical Data Extraction: Resolved by Turn Histograms
This document contains a detailed extraction of data from two side-by-side histograms comparing the performance of two AI models (GPT-4 and Claude 3 Opus) in terms of how many "turns" it takes to resolve a task.
## 1. General Metadata
* **Image Type:** Comparative Histograms (Frequency Distributions).
* **Primary Language:** English.
* **Visual Style:** Blue bars with black outlines on a white background.
* **Common Y-Axis Label:** Count (Frequency of occurrences).
* **Common X-Axis Label:** Turn (The number of interactions/steps taken).
---
## 2. Component Analysis: Left Chart (GPT-4)
### Header Information
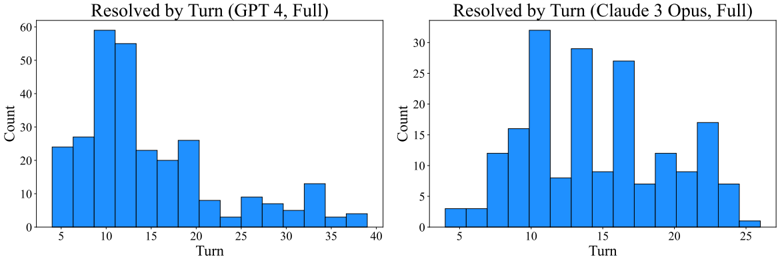
* **Title:** Resolved by Turn (GPT 4, Full)
### Axis Scales
* **Y-Axis (Count):** Ranges from 0 to 60, with major tick marks every 10 units (0, 10, 20, 30, 40, 50, 60).
* **X-Axis (Turn):** Ranges from approximately 4 to 40, with major tick marks every 5 units (5, 10, 15, 20, 25, 30, 35, 40).
### Data Distribution & Trends
* **Trend Description:** The distribution is unimodal and right-skewed. There is a significant peak (mode) between turns 8 and 13, followed by a steady decline with a small secondary bump around turn 18-20. The data trails off significantly after turn 35.
* **Estimated Data Points (Bin Counts):**
* **Turns 4-6:** ~24
* **Turns 6-8:** ~27
* **Turns 8-11 (Peak):** ~59
* **Turns 11-13:** ~55
* **Turns 13-15:** ~23
* **Turns 15-18:** ~20
* **Turns 18-20:** ~26
* **Turns 20-23:** ~8
* **Turns 23-25:** ~3
* **Turns 25-28:** ~9
* **Turns 28-30:** ~7
* **Turns 30-32:** ~5
* **Turns 32-34:** ~13
* **Turns 34-37:** ~3
* **Turns 37-40:** ~4
---
## 3. Component Analysis: Right Chart (Claude 3 Opus)
### Header Information
* **Title:** Resolved by Turn (Claude 3 Opus, Full)
### Axis Scales
* **Y-Axis (Count):** Ranges from 0 to 30+, with major tick marks every 5 units (0, 5, 10, 15, 20, 25, 30). Note: The highest bar exceeds the 30 mark.
* **X-Axis (Turn):** Ranges from approximately 4 to 26, with major tick marks every 5 units (5, 10, 15, 20, 25).
### Data Distribution & Trends
* **Trend Description:** The distribution is multimodal and more compressed than the GPT-4 chart. It shows three distinct peaks: a primary peak around turn 10-11, a secondary peak at turn 14, and a tertiary peak at turn 16-17. The resolution process for this model appears to conclude much earlier (by turn 26) compared to GPT-4 (which goes to turn 40).
* **Estimated Data Points (Bin Counts):**
* **Turns 4-5:** ~3
* **Turns 6-7:** ~3
* **Turns 7-8:** ~12
* **Turns 8-10:** ~16
* **Turns 10-11 (Highest Peak):** ~32
* **Turns 11-13:** ~8
* **Turns 13-14 (Secondary Peak):** ~29
* **Turns 14-16:** ~9
* **Turns 16-17 (Tertiary Peak):** ~27
* **Turns 17-19:** ~7
* **Turns 19-20:** ~12
* **Turns 20-22:** ~9
* **Turns 22-23:** ~17
* **Turns 23-25:** ~7
* **Turns 25-26:** ~1
---
## 4. Comparative Summary
| Feature | GPT-4 (Full) | Claude 3 Opus (Full) |
| :--- | :--- | :--- |
| **Max Turn Count** | ~40 Turns | ~26 Turns |
| **Highest Frequency** | ~59 (at Turn 10) | ~32 (at Turn 10) |
| **Distribution Shape** | Single dominant peak, long tail. | Multiple distinct peaks, shorter range. |
| **Efficiency Indicator** | Resolves most tasks by turn 15, but has many outliers. | Resolves tasks in a tighter window, finishing all by turn 26. |