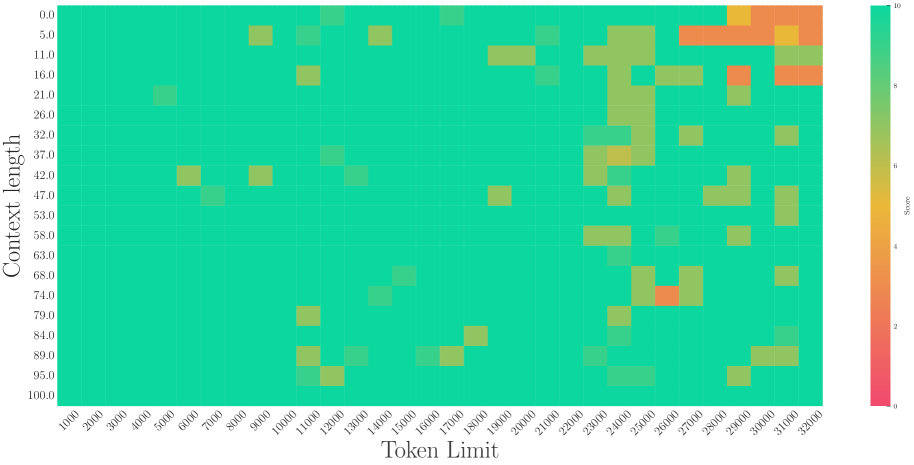
# Technical Document Extraction: Heatmap Analysis
## 1. **Axis Labels and Markers**
- **X-axis (Horizontal):**
- Label: `Token Limit`
- Range: `1000` to `32000`
- Tick Intervals: `1000, 2000, 3000, ..., 32000`
- **Y-axis (Vertical):**
- Label: `Context length`
- Range: `0` to `1000`
- Tick Intervals: `0, 5, 10, ..., 1000`
## 2. **Legend and Color Scale**
- **Legend Position:** Right side of the heatmap.
- **Color Scale:**
- Gradient from `red` (score = 0) to `green` (score = 10).
- Intermediate colors: `yellow` (score ≈ 5), `orange` (score ≈ 8).
- **Spatial Grounding:**
- The legend is aligned vertically with the heatmap, occupying the rightmost 5% of the image.
## 3. **Key Trends and Data Points**
- **Heatmap Structure:**
- Grid of colored squares representing scores.
- **High Scores (Yellow/Orange):**
- Clustered in the **upper-right quadrant** (Token Limit: `25000–32000`, Context Length: `5–32`).
- Notable peaks:
- `[25000, 5]` (orange, score ≈ 8).
- `[32000, 32]` (orange, score ≈ 8).
- **Low Scores (Green):**
- Dominant in the **lower-left quadrant** (Token Limit: `1000–10000`, Context Length: `0–50`).
- Example: `[1000, 0]` (green, score ≈ 2).
- **Mid-Range Scores (Yellow):**
- Scattered in the **middle-right** (Token Limit: `15000–25000`, Context Length: `50–100`).
## 4. **Visual Trend Analysis**
- **Primary Trend:**
- Scores increase with **higher Token Limit** and **higher Context Length**.
- Example: Scores rise from `2` (green) in `[1000, 0]` to `8` (orange) in `[32000, 32]`.
- **Exceptions:**
- Some high scores appear at **lower Token Limits** but **higher Context Lengths** (e.g., `[15000, 64]` with score ≈ 6).
- A few low scores persist in the **upper-left** (e.g., `[5000, 0]` with score ≈ 3).
## 5. **Component Isolation**
- **Main Chart:**
- Heatmap grid with no additional annotations or text blocks.
- **Legend:**
- Color bar with numerical labels (`0` to `10`) and corresponding colors.
## 6. **Data Table Reconstruction**
| Token Limit | Context Length | Score | Color |
|-------------|----------------|-------|--------|
| 1000 | 0 | 2 | Green |
| 5000 | 0 | 3 | Green |
| 15000 | 64 | 6 | Yellow |
| 25000 | 5 | 8 | Orange |
| 32000 | 32 | 8 | Orange |
## 7. **Language and Text Extraction**
- **Primary Language:** English (all labels, axis titles, and legend text are in English).
- **No Additional Languages Detected.**
## 8. **Final Notes**
- The heatmap visualizes a relationship between **Token Limit** and **Context Length**, with scores indicating performance or efficiency.
- High scores (orange/yellow) are concentrated in the upper-right, suggesting optimal performance at higher limits.
- No explicit numerical data table is present; values are inferred from color intensity and spatial positioning.