## Time Series Chart: Lagged Work Index vs. Office Occupancy Index
### Overview
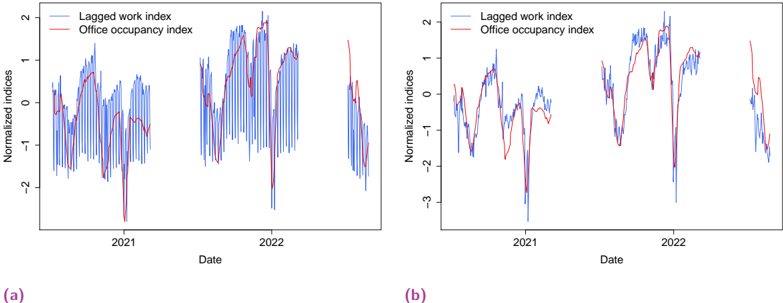
The image presents two time series charts, labeled (a) and (b), comparing the "Lagged work index" (blue) and "Office occupancy index" (red) over the years 2021 and 2022. Chart (a) displays the "Lagged work index" as a series of vertical blue lines, while chart (b) displays it as a continuous blue line. The "Office occupancy index" is represented as a continuous red line in both charts. The y-axis represents "Normalized indices."
### Components/Axes
* **X-axis (Date):** Both charts span the years 2021 and 2022.
* **Y-axis (Normalized indices):**
* Chart (a) ranges from -2 to 2, with tick marks at -2, -1, 0, 1, and 2.
* Chart (b) ranges from -3 to 2, with tick marks at -3, -2, -1, 0, 1, and 2.
* **Legend (Top-Left):**
* "Lagged work index" - represented by the color blue.
* "Office occupancy index" - represented by the color red.
### Detailed Analysis
**Chart (a):**
* **Lagged work index (blue vertical lines):** The index fluctuates significantly throughout 2021 and 2022. There are periods of high activity (closer to 1 or 2) and periods of low activity (closer to -2). The index appears to show a cyclical pattern, possibly reflecting weekly or seasonal variations.
* Approximate values: The blue lines range from approximately -2.2 to 1.8.
* **Office occupancy index (red line):** The occupancy index generally trends upward from early 2021 to late 2022, with some dips and peaks along the way. It starts around -1.0 in early 2021, rises to around 1.5 by late 2022, and then decreases towards the end of the period.
* Approximate values: The red line ranges from approximately -2.5 to 1.8.
**Chart (b):**
* **Lagged work index (blue line):** The index fluctuates throughout 2021 and 2022. The index appears to show a cyclical pattern, possibly reflecting weekly or seasonal variations.
* Approximate values: The blue line ranges from approximately -3 to 2.
* **Office occupancy index (red line):** The occupancy index generally trends upward from early 2021 to late 2022, with some dips and peaks along the way. It starts around -2.5 in early 2021, rises to around 1.8 by late 2022, and then decreases towards the end of the period.
* Approximate values: The red line ranges from approximately -2.5 to 1.8.
### Key Observations
* Both charts show a general upward trend in the "Office occupancy index" from 2021 to 2022.
* The "Lagged work index" exhibits more frequent and larger fluctuations compared to the "Office occupancy index."
* Chart (a) uses vertical lines to represent the "Lagged work index," which may emphasize the discrete nature of the data or highlight specific data points. Chart (b) uses a continuous line, which may emphasize the overall trend.
* The y-axis scale differs slightly between the two charts, with chart (b) having a wider range (-3 to 2) than chart (a) (-2 to 2).
### Interpretation
The charts suggest a relationship between the "Lagged work index" and "Office occupancy index." The upward trend in office occupancy could be related to changes in the lagged work index, although the exact nature of the relationship would require further analysis. The fluctuations in the lagged work index may reflect external factors such as public holidays, seasonal changes, or other events that impact work patterns. The difference in representation of the "Lagged work index" between the two charts may be intended to highlight different aspects of the data. Chart (a) emphasizes the individual data points, while chart (b) emphasizes the overall trend.