## Line Graphs: Normalized Indices Over Time (2021-2022)
### Overview
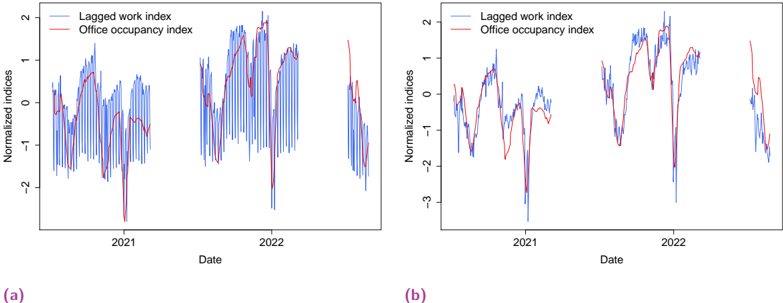
The image contains two line graphs (labeled **a** and **b**) comparing two metrics over time:
- **Lagged work index** (blue line)
- **Office occupancy index** (red line)
Both graphs span the years **2021 to 2022**, with normalized indices on the y-axis and dates on the x-axis. The y-axis ranges from **-3 to 2**, and the x-axis includes unlabeled monthly intervals.
---
### Components/Axes
- **X-axis (Date)**:
- Labeled "Date"
- Unlabeled monthly intervals spanning **2021 to 2022** (exact months not specified).
- **Y-axis (Normalized Indices)**:
- Labeled "Normalized indices"
- Ticks at **-3, -2, -1, 0, 1, 2**.
- **Legend**:
- Located in the **top-left corner** of both graphs.
- Blue line: "Lagged work index"
- Red line: "Office occupancy index"
---
### Detailed Analysis
#### Graph (a)
- **Lagged work index (blue)**:
- Highly volatile, with sharp peaks and troughs.
- Peaks near **1.5** (early 2021) and **-2.5** (mid-2021).
- Ends near **-1.5** in late 2022.
- **Office occupancy index (red)**:
- Smoother fluctuations compared to the blue line.
- Peaks near **1** (early 2021) and **-1.5** (mid-2021).
- Ends near **-0.5** in late 2022.
#### Graph (b)
- **Lagged work index (blue)**:
- Even more erratic than in graph (a).
- Peaks near **2** (early 2021) and **-3** (mid-2021).
- Ends near **-2** in late 2022.
- **Office occupancy index (red)**:
- Slight upward trend toward the end of 2022.
- Peaks near **1.5** (early 2021) and **0.5** (late 2022).
---
### Key Observations
1. **Volatility**: The lagged work index exhibits significantly more volatility than the office occupancy index in both graphs.
2. **Divergence**: In graph (b), the office occupancy index shows a slight upward trend in late 2022, while the lagged work index remains unstable.
3. **Anomalies**: Sharp dips in the lagged work index (e.g., mid-2021 in both graphs) suggest external disruptions (e.g., policy changes, economic shifts).
---
### Interpretation
- **Lagged work index**: Reflects sensitivity to external factors (e.g., remote work adoption, economic crises). Its volatility indicates instability in work patterns, possibly due to rapid adaptation to new norms (e.g., post-pandemic shifts).
- **Office occupancy index**: Smoother trends suggest more stable occupancy rates, potentially tied to fixed office requirements or slower adaptation to external changes.
- **Graph (b) divergence**: The slight upward trend in office occupancy in late 2022 may indicate a partial return to pre-pandemic office usage, while the lagged work index’s instability could reflect ongoing uncertainty in hybrid work models.
**Note**: Exact numerical values are approximate due to the absence of labeled data points. The graphs emphasize relative trends rather than absolute measurements.