TECHNICAL ASSET FINGERPRINT
43526082c545adddd5d79e72
Click to view fullscreen
Press ESC or click to close
FOUND IN PAPERS
EXPERT: healer-alpha-free VERSION 1
RUNTIME: free/openrouter/healer-alpha
INTEL_VERIFIED
## Multi-Panel Technical Figure: Experimental Trials and State Transition Matrices
### Overview
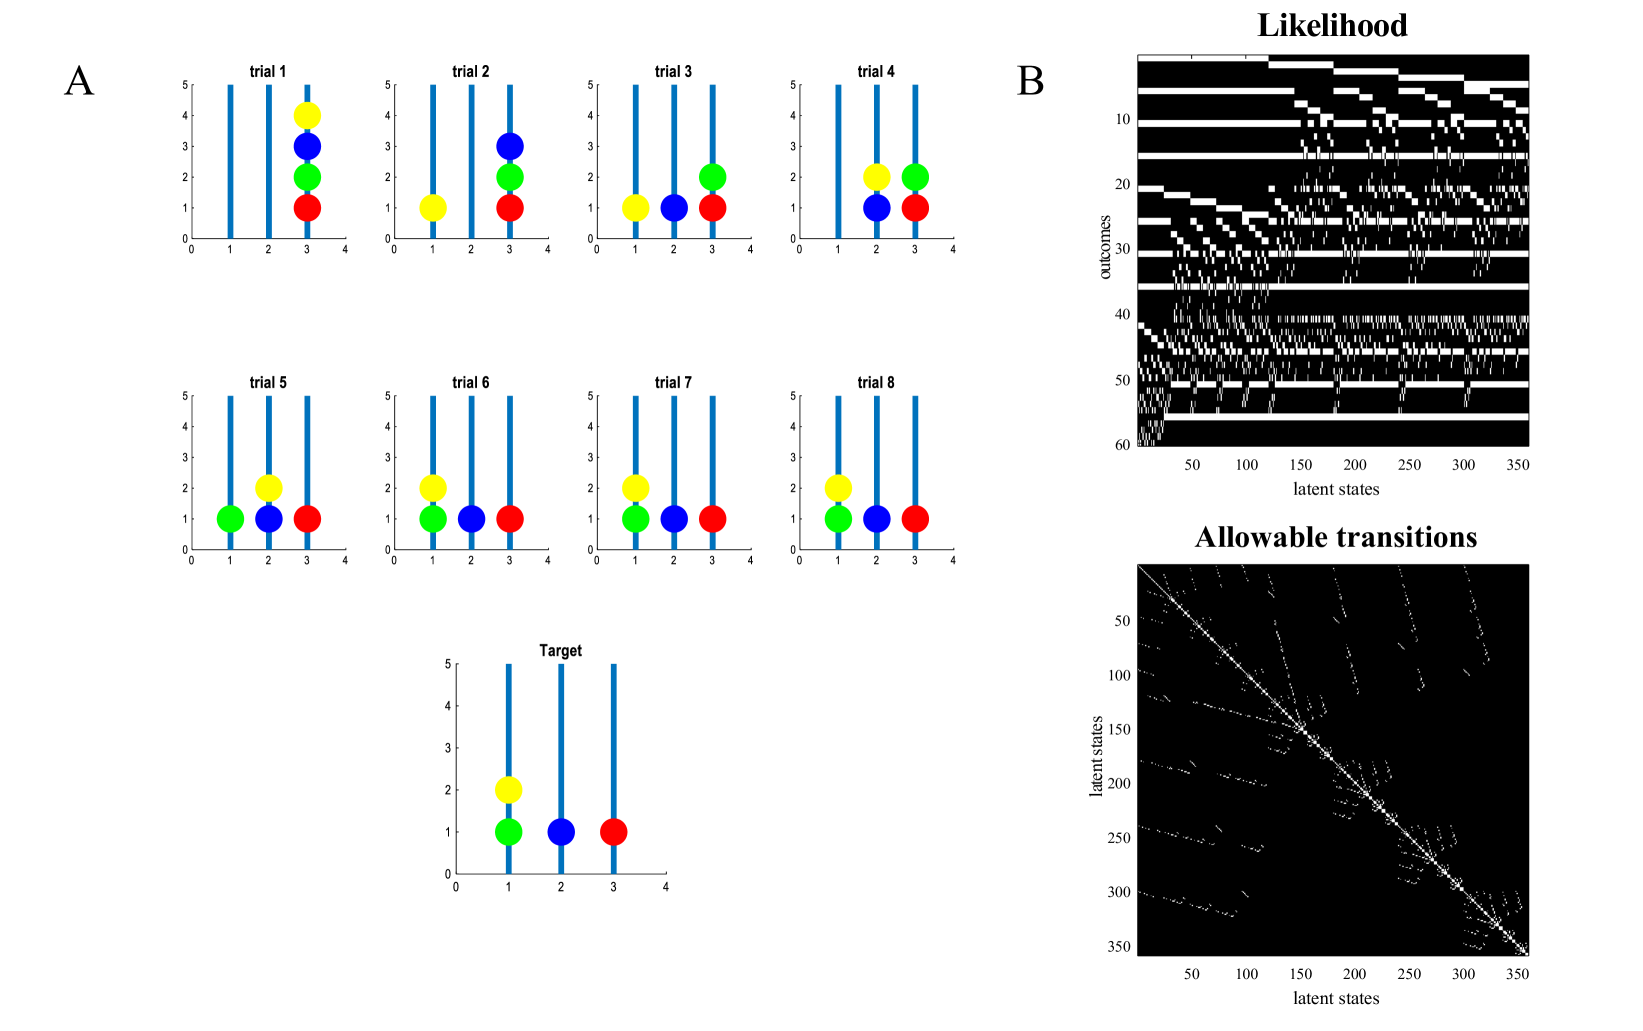
The image is a composite figure containing two main panels, labeled **A** and **B**. Panel A displays a series of 8 experimental trials and a final "Target" configuration, visualized as colored dots on vertical bars. Panel B contains two large heatmap-style matrices titled "Likelihood" and "Allowable transitions," which appear to represent relationships between "latent states" and "outcomes." The overall figure likely illustrates a process of learning or optimization, where trials in Panel A attempt to match a target configuration, and Panel B visualizes the underlying model's structure.
### Components/Axes
**Panel A (Left Side):**
* **Structure:** A 3x3 grid of small bar charts (with the bottom-right position empty). The charts are labeled: `trial 1`, `trial 2`, `trial 3`, `trial 4` (top row); `trial 5`, `trial 6`, `trial 7`, `trial 8` (middle row); `Target` (bottom row, centered).
* **Axes (for each chart):**
* **X-axis:** Unlabeled, with numerical markers at `0`, `1`, `2`, `3`, `4`.
* **Y-axis:** Unlabeled, with numerical markers from `0` to `5` in increments of 1.
* **Data Elements:** Each chart contains three vertical blue bars positioned at x=1, x=2, and x=3. Colored circles (dots) are placed on these bars at specific y-values.
* **Color Key (Implicit):** Four distinct colors are used for the dots: **Yellow**, **Blue**, **Green**, **Red**. Their meaning is not explicitly stated in a legend but is consistent across all trials.
**Panel B (Right Side):**
* **Top Matrix: "Likelihood"**
* **X-axis:** Labeled `latent states`, with numerical markers at `50`, `100`, `150`, `200`, `250`, `300`, `350`.
* **Y-axis:** Labeled `outcomes`, with numerical markers at `10`, `20`, `30`, `40`, `50`, `60`.
* **Content:** A black-and-white (binary) matrix. White pixels represent a value of 1 (or "high likelihood"), and black pixels represent 0 (or "low likelihood").
* **Bottom Matrix: "Allowable transitions"**
* **X-axis:** Labeled `latent states`, with numerical markers at `50`, `100`, `150`, `200`, `250`, `300`, `350`.
* **Y-axis:** Labeled `latent states`, with numerical markers at `50`, `100`, `150`, `200`, `250`, `300`, `350`.
* **Content:** A black-and-white (binary) matrix. White pixels indicate a permissible transition from the state on the x-axis to the state on the y-axis.
### Detailed Analysis
**Panel A: Trial Configurations**
The position of the colored dots changes across trials, suggesting a sequential adjustment process. The "Target" chart defines the goal state.
* **Target Configuration:**
* **Bar at x=1:** Green dot at y=1, Yellow dot at y=2.
* **Bar at x=2:** Blue dot at y=1.
* **Bar at x=3:** Red dot at y=1.
* **Trial Progression (Approximate Y-values):**
* **trial 1:** (x=3) Red=1, Green=2, Blue=3, Yellow=4. All dots are stacked on the rightmost bar.
* **trial 2:** (x=1) Yellow=1. (x=3) Red=1, Green=2, Blue=3. Yellow dot has moved to the leftmost bar.
* **trial 3:** (x=1) Yellow=1. (x=2) Blue=1. (x=3) Red=1, Green=2. Blue dot has moved to the center bar.
* **trial 4:** (x=2) Blue=1, Yellow=2. (x=3) Red=1, Green=2. Yellow dot moves up on the center bar.
* **trial 5:** (x=1) Green=1. (x=2) Blue=1, Yellow=2. (x=3) Red=1. Green dot moves to the leftmost bar.
* **trial 6:** (x=1) Green=1, Yellow=2. (x=2) Blue=1. (x=3) Red=1. Yellow dot moves to the leftmost bar.
* **trial 7:** (x=1) Green=1, Yellow=2. (x=2) Blue=1. (x=3) Red=1. *Identical to trial 6.*
* **trial 8:** (x=1) Green=1, Yellow=2. (x=2) Blue=1. (x=3) Red=1. *Identical to trial 6 and 7.*
**Trend Verification:** The sequence shows a clear convergence. Dots start stacked on one bar (trial 1) and are progressively distributed across the three bars. By trial 6, the configuration matches the "Target" exactly, and trials 7 and 8 show no further change, indicating the goal has been achieved and stabilized.
**Panel B: State Matrices**
* **"Likelihood" Matrix:** This matrix shows a highly structured, non-random pattern. Key features include:
* **Horizontal Bands:** Several solid or densely packed white horizontal lines (e.g., near y=5, y=10, y=15, y=25, y=35, y=45, y=55). This indicates that certain outcomes (y-values) are associated with a wide range of latent states.
* **Diagonal/Block Structure:** There is a prominent block-diagonal or staircase pattern, particularly visible in the upper half (y=0 to y=30). This suggests clusters of latent states are strongly associated with specific, sequential outcomes.
* **Sparse Regions:** The lower half (y=30 to y=60) is more sparse and noisy, with fewer large, coherent white blocks.
* **"Allowable transitions" Matrix:** This matrix is predominantly black with white pixels forming a specific pattern.
* **Strong Main Diagonal:** A clear, continuous white line runs from the top-left (0,0) to the bottom-right (350,350). This indicates that the most common or allowable transition is from a state to itself (self-transitions).
* **Off-Diagonal Points:** Scattered white pixels appear near the main diagonal, forming a thin band. This suggests that transitions are primarily allowed between a state and its immediate neighbors (e.g., state `n` can transition to `n-1`, `n`, or `n+1`).
* **Structured Off-Diagonal Clusters:** There are also distinct, sparse clusters of white points further from the diagonal (e.g., around (150, 50) and (250, 150)). These represent specific, non-adjacent state transitions that are permitted by the model.
### Key Observations
1. **Convergence in Panel A:** The system reaches its target configuration by trial 6 and remains stable thereafter. The movement of dots appears methodical, one or two per trial.
2. **Color Consistency:** The four colors (Yellow, Blue, Green, Red) are used consistently across all trials and the target, implying they represent four distinct entities or parameters being positioned.
3. **Matrix Structure in Panel B:** Neither heatmap is random. The "Likelihood" matrix has clear horizontal and block-diagonal features, while the "Allowable transitions" matrix is dominated by a diagonal band, indicating a strong locality constraint in the state space.
4. **Scale Discrepancy:** The "latent states" axis in Panel B (0-350) is much larger than the simple 3-bar system in Panel A, suggesting Panel B describes a more complex, high-dimensional underlying model.
### Interpretation
This figure likely comes from a study on **structured learning, planning, or state-space modeling**.
* **Panel A** demonstrates a **successful optimization or learning process**. The agent (or algorithm) starts with a poor, stacked configuration and iteratively adjusts the positions of four colored components across three locations to match a predefined target. The stability from trial 6 onward confirms the solution is found and robust.
* **Panel B** reveals the **internal structure of the model** governing this process. The "Allowable transitions" matrix defines the "rules of movement" in the latent state space—primarily local moves with a few specific long-range jumps allowed. The "Likelihood" matrix maps these latent states to observable outcomes, showing that outcomes are not independent but are generated by structured, clustered states. The horizontal bands in the Likelihood matrix might represent "default" or highly probable outcomes across many states.
* **Connection:** The simple, discrete task in Panel A is likely a **visualization or test case** for an algorithm that operates within the complex, high-dimensional state space characterized by the matrices in Panel B. The algorithm's success in Panel A validates its ability to navigate the allowable transitions and find a state configuration with high likelihood for the target outcome. The figure as a whole argues for the effectiveness of a model that respects structured, local transitions in its latent space to solve concrete positioning tasks.
DECODING INTELLIGENCE...