## Diagram: Experimental Trials and Latent State Analysis
### Overview
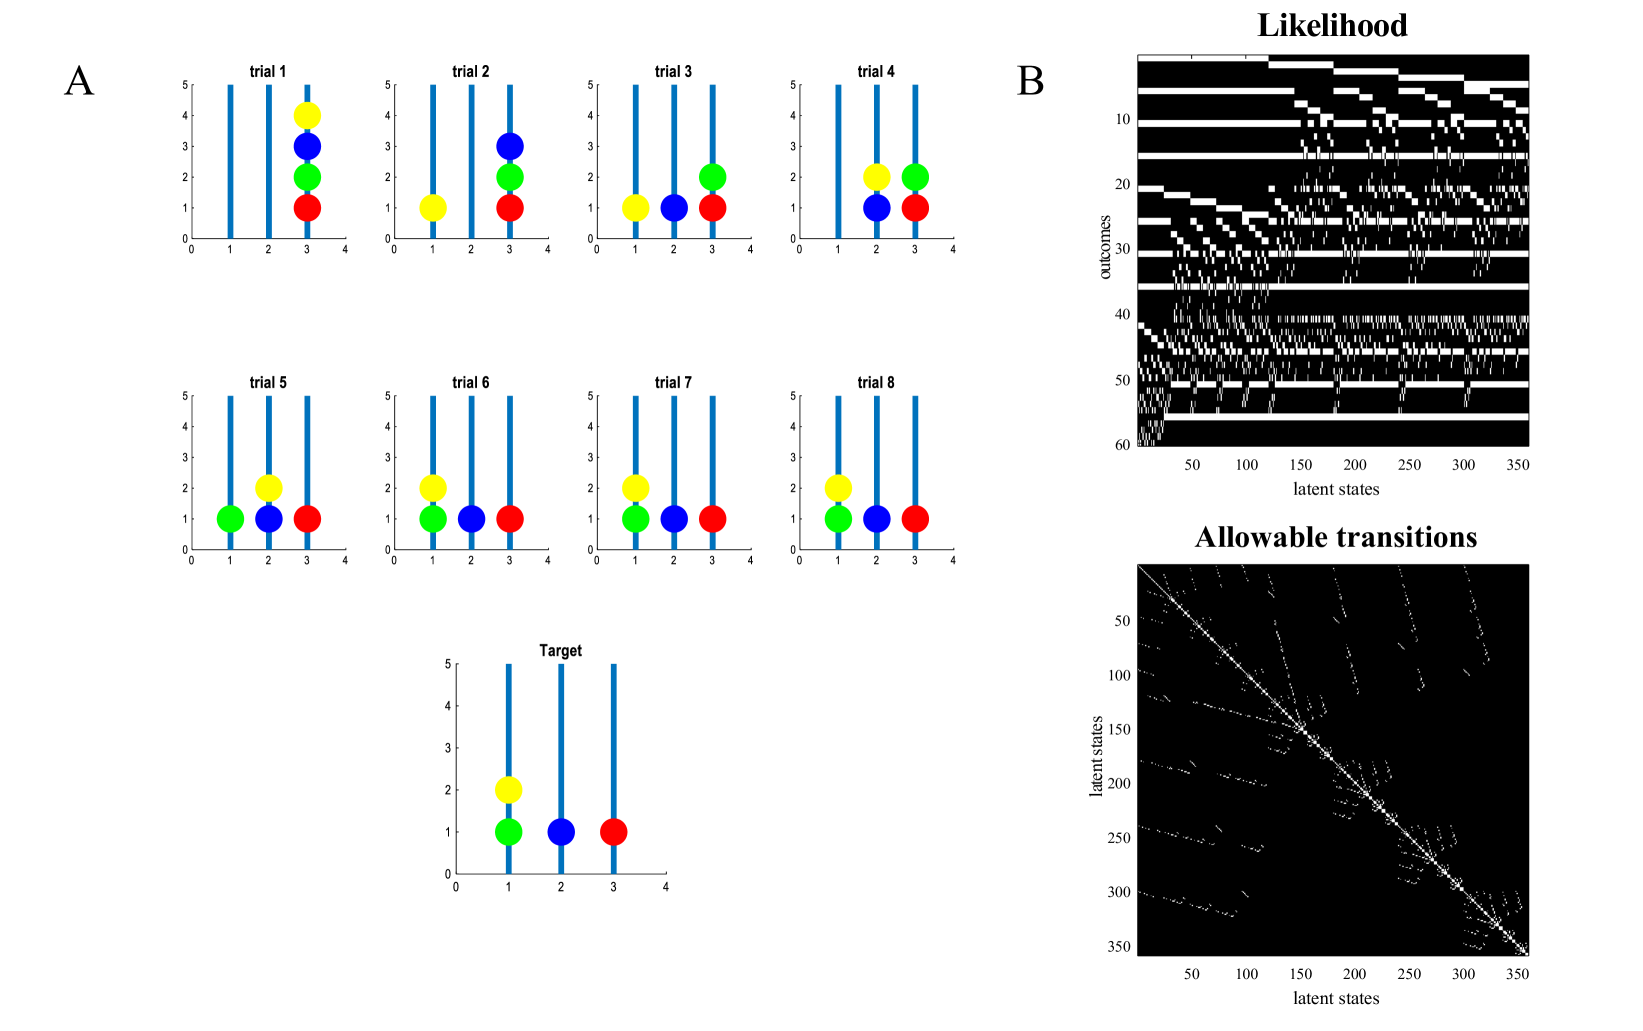
The image presents two primary sections:
1. **Section A**: Eight trial diagrams (Trial 1–8) with colored circles positioned along vertical bars, representing outcomes or states.
2. **Section B**: Two heatmaps labeled "Likelihood" and "Allowable transitions," visualizing relationships between latent states and outcomes.
---
### Components/Axes
#### Section A: Trial Diagrams
- **X-axis**: Positional scale (0–4) for each trial.
- **Y-axis**: Trial labels (Trial 1–8).
- **Legend**:
- Green circle: "Green"
- Blue circle: "Blue"
- Red circle: "Red"
- **Note**: Yellow circles appear in diagrams but are not labeled in the legend.
#### Section B: Heatmaps
1. **Likelihood Heatmap**:
- **X-axis**: Latent states (50–350).
- **Y-axis**: Outcomes (0–60).
- **Pattern**: Dense white regions indicate higher likelihood.
2. **Allowable Transitions Heatmap**:
- **X-axis**: Latent states (50–350).
- **Y-axis**: Latent states (50–350).
- **Pattern**: Diagonal clusters of white dots suggest permissible transitions between similar latent states.
---
### Detailed Analysis
#### Section A: Trial Diagrams
- **Trial 1**:
- Yellow circle at position 2.
- Blue circle at position 3.
- Green circle at position 2.
- Red circle at position 3.
- **Trial 2**:
- Yellow circle at position 1.
- Blue circle at position 3.
- Green circle at position 2.
- Red circle at position 3.
- **Trial 3**:
- Yellow circle at position 1.
- Blue circle at position 2.
- Green circle at position 2.
- Red circle at position 3.
- **Trial 4**:
- Yellow circle at position 2.
- Blue circle at position 2.
- Green circle at position 2.
- Red circle at position 3.
- **Trial 5**:
- Yellow circle at position 2.
- Blue circle at position 3.
- Green circle at position 1.
- Red circle at position 3.
- **Trial 6**:
- Yellow circle at position 1.
- Blue circle at position 2.
- Green circle at position 2.
- Red circle at position 3.
- **Trial 7**:
- Yellow circle at position 2.
- Blue circle at position 2.
- Green circle at position 2.
- Red circle at position 3.
- **Trial 8**:
- Yellow circle at position 2.
- Blue circle at position 2.
- Green circle at position 2.
- Red circle at position 3.
- **Target Diagram**:
- Yellow circle at position 2.
- Green circle at position 1.
- Blue circle at position 2.
- Red circle at position 3.
#### Section B: Heatmaps
1. **Likelihood Heatmap**:
- High likelihood (dense white) occurs for latent states ~150–250 and outcomes ~30–40.
- Low likelihood (sparse white) dominates at latent states <100 and outcomes <20.
2. **Allowable Transitions Heatmap**:
- Diagonal bands of white dots indicate transitions between latent states with small differences (e.g., 50–100 → 50–100).
- Sparse transitions occur for large latent state differences (e.g., 50 → 350).
---
### Key Observations
1. **Section A**:
- Yellow circles (unlabeled in the legend) consistently appear at position 1 or 2 across trials.
- Red circles dominate position 3 in most trials.
- The "Target" diagram mirrors Trial 4 but includes a green circle at position 1.
2. **Section B**:
- Likelihood peaks for mid-range latent states and outcomes.
- Allowable transitions are constrained to proximate latent states.
---
### Interpretation
- **Section A**:
- The trials likely represent experimental conditions or states, with colored circles indicating observed outcomes. The unlabeled yellow circles may represent an unaccounted category or error.
- The "Target" diagram suggests a desired configuration, aligning with Trial 4 but adding a green circle at position 1.
- **Section B**:
- The "Likelihood" heatmap implies that mid-range latent states and outcomes are most probable.
- The "Allowable Transitions" heatmap enforces a constraint that state changes are limited to similar latent states, preventing abrupt transitions.
- **Cross-Section Insight**:
- The trials in Section A may map to latent states in Section B, with colors representing outcome distributions. For example, red circles (position 3) could correspond to higher likelihood values in the heatmap.
- **Anomalies**:
- The absence of a legend entry for yellow circles introduces ambiguity.
- The "Target" diagram’s green circle at position 1 deviates from most trials, where green circles appear at position 2.
This analysis highlights the relationship between experimental outcomes (Section A) and latent state dynamics (Section B), emphasizing constraints on state transitions and probable outcomes.