\n
## Aerial Image Comparison: 3D-GS Performance
### Overview
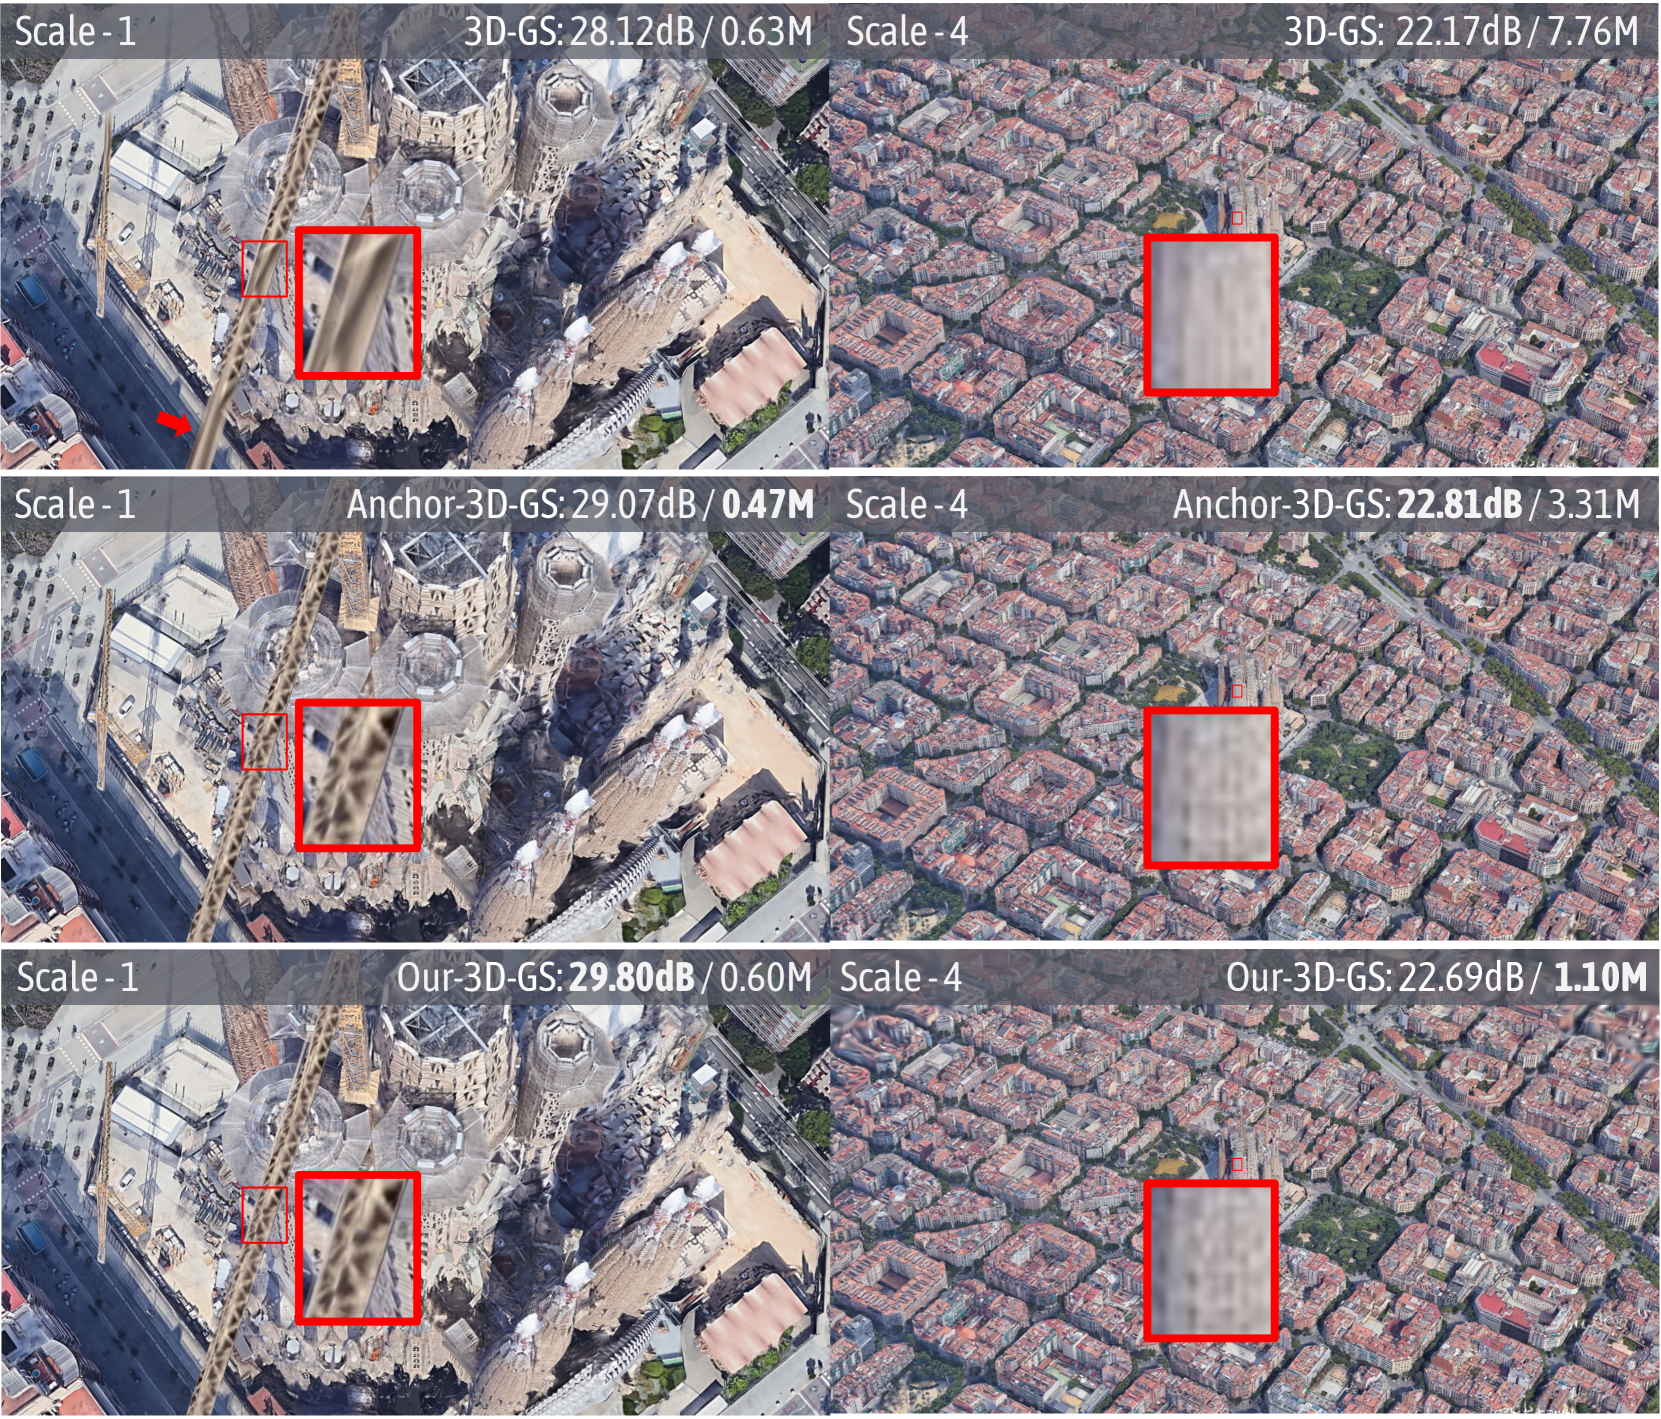
The image presents a comparative analysis of 3D-GS performance across different scales and methods (3D-GS, Anchor-3D-GS, and Our-3D-GS) visualized over aerial imagery of a densely built urban area. Each method is evaluated at two scales: Scale -1 and Scale -4. The performance is indicated by a dB value and a corresponding memory usage in megabytes (M). Each method's output is highlighted by a red bounding box in the image.
### Components/Axes
The image does not contain traditional axes or charts. Instead, it presents a visual comparison of results overlaid on aerial imagery. The key components are:
* **Aerial Imagery:** Provides the context of the urban environment.
* **Red Bounding Boxes:** Highlight the areas where each method's output is displayed.
* **Scale Labels:** "Scale -1" and "Scale -4" indicate the scale at which the method was applied.
* **Method Labels:** "3D-GS", "Anchor-3D-GS", and "Our-3D-GS" identify the different methods being compared.
* **Performance Metrics:** dB values (e.g., "28.12dB") and memory usage (e.g., "0.63M") quantify the performance of each method.
### Detailed Analysis or Content Details
The image displays the following data points:
* **3D-GS, Scale -1:** 28.12dB / 0.63M
* **3D-GS, Scale -4:** 22.17dB / 7.76M
* **Anchor-3D-GS, Scale -1:** 29.07dB / 0.47M
* **Anchor-3D-GS, Scale -4:** 22.81dB / 3.31M
* **Our-3D-GS, Scale -1:** 29.80dB / 0.60M
* **Our-3D-GS, Scale -4:** 22.69dB / 1.10M
The dB values generally decrease as the scale changes from -1 to -4 for all methods. The memory usage generally increases as the scale changes from -1 to -4.
### Key Observations
* **"Our-3D-GS" consistently achieves the highest dB values** at both scales, indicating the best performance in terms of the metric used.
* **"Anchor-3D-GS" performs better than "3D-GS"** at Scale -1, but the difference is smaller at Scale -4.
* **"3D-GS" has the highest memory usage at Scale -4** (7.76M), while "Anchor-3D-GS" has the lowest memory usage at Scale -1 (0.47M).
* The visual quality of the output within the red boxes appears to vary, but a quantitative assessment is not possible without further information about the metric used to calculate the dB values.
### Interpretation
The data suggests that "Our-3D-GS" is the most effective method for this task, consistently delivering the highest performance (as measured by dB) across both scales. However, this comes at a cost of increased memory usage compared to "Anchor-3D-GS". The decrease in dB values as the scale changes from -1 to -4 indicates that performance degrades as the scale increases. This could be due to the increased complexity of the scene at larger scales or limitations in the methods’ ability to generalize to different scales. The relationship between dB and memory usage suggests a trade-off between performance and computational resources. The choice of method would depend on the specific application and the relative importance of performance and memory constraints. The aerial imagery provides context, showing that the methods are being applied to a complex urban environment with dense building structures. The red bounding boxes highlight the areas where the methods are attempting to reconstruct or analyze the 3D structure of the scene. The dB values likely represent a measure of reconstruction accuracy or similarity to a ground truth. Without knowing the exact definition of the dB metric, it is difficult to draw more specific conclusions.