## Chart: Proportion of Flips vs. Iterations for Qwen2.5-14B
### Overview
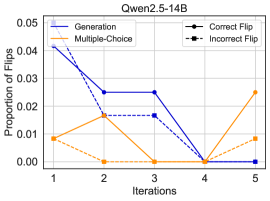
The image is a line chart comparing the proportion of flips (correct and incorrect) across iterations for two methods: Generation and Multiple-Choice, using the Qwen2.5-14B model. The x-axis represents iterations (1 to 5), and the y-axis represents the proportion of flips (0.00 to 0.05).
### Components/Axes
* **Title:** Qwen2.5-14B
* **X-axis:** Iterations (1, 2, 3, 4, 5)
* **Y-axis:** Proportion of Flips (0.00, 0.01, 0.02, 0.03, 0.04, 0.05)
* **Legend:** Located in the top-left and top-right corners.
* **Generation:** Solid dark blue line
* **Multiple-Choice:** Solid orange line
* **Correct Flip:** Solid black line with circular markers
* **Incorrect Flip:** Dashed black line with square markers
### Detailed Analysis
* **Generation (Solid Dark Blue Line):**
* Trend: Decreasing from iteration 1 to 5.
* Data Points:
* Iteration 1: ~0.042
* Iteration 2: ~0.025
* Iteration 3: ~0.025
* Iteration 4: ~0.000
* Iteration 5: ~0.000
* **Multiple-Choice (Solid Orange Line):**
* Trend: Decreasing from iteration 1 to 4, then increasing to iteration 5.
* Data Points:
* Iteration 1: ~0.008
* Iteration 2: ~0.017
* Iteration 3: ~0.000
* Iteration 4: ~0.000
* Iteration 5: ~0.025
* **Correct Flip (Solid Black Line with Circular Markers):**
* Trend: Decreasing from iteration 1 to 4, then increasing to iteration 5.
* Data Points:
* Iteration 1: ~0.042
* Iteration 2: ~0.017
* Iteration 3: ~0.017
* Iteration 4: ~0.000
* Iteration 5: ~0.000
* **Incorrect Flip (Dashed Black Line with Square Markers):**
* Trend: Decreasing from iteration 1 to 4, then increasing to iteration 5.
* Data Points:
* Iteration 1: ~0.008
* Iteration 2: ~0.000
* Iteration 3: ~0.000
* Iteration 4: ~0.000
* Iteration 5: ~0.008
### Key Observations
* The "Generation" method starts with a higher proportion of flips but decreases to zero by iteration 4.
* The "Multiple-Choice" method starts low, decreases to zero by iteration 4, and then increases at iteration 5.
* The "Correct Flip" and "Incorrect Flip" lines mirror the trends of "Generation" and "Multiple-Choice" respectively.
### Interpretation
The chart illustrates how the proportion of flips changes over iterations for two different methods (Generation and Multiple-Choice) in the Qwen2.5-14B model. The "Generation" method initially has a higher proportion of flips, suggesting it might be more prone to errors early on, but it quickly converges to zero. The "Multiple-Choice" method starts with a lower error rate, remains stable for a few iterations, but then increases at iteration 5, indicating a potential issue with later iterations. The "Correct Flip" and "Incorrect Flip" lines likely represent the breakdown of flips within each method, showing how many were corrected versus how many remained incorrect. The data suggests that the "Generation" method might benefit from early intervention to reduce initial flips, while the "Multiple-Choice" method might need attention in later iterations to prevent the increase in flips.