\n
## Line Chart: Qwen2.5-14B - Proportion of Flips vs. Iterations
### Overview
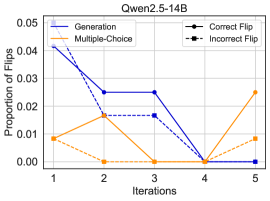
This line chart displays the proportion of flips observed across different iterations for various methods: Generation, Multiple-Choice, Correct Flip, and Incorrect Flip. The chart aims to illustrate how the frequency of flips changes with each iteration for each method. The title "Qwen2.5-14B" suggests this data relates to a model or experiment using that specific configuration.
### Components/Axes
* **X-axis:** Iterations (labeled 1 to 5).
* **Y-axis:** Proportion of Flips (scale from 0.00 to 0.05).
* **Legend:**
* Generation (Solid Blue Line)
* Multiple-Choice (Solid Orange Line)
* Correct Flip (Solid Black Line with Circle Markers)
* Incorrect Flip (Dashed Black Line with Square Markers)
* **Title:** Qwen2.5-14B (positioned at the top-center)
### Detailed Analysis
The chart shows the following trends and approximate data points:
* **Generation (Solid Blue Line):** This line starts at approximately 0.042 at Iteration 1 and decreases steadily to approximately 0.002 at Iteration 5. There is a plateau between Iterations 2 and 3, remaining around 0.026.
* **Multiple-Choice (Solid Orange Line):** This line begins at approximately 0.01 at Iteration 1, increases to approximately 0.018 at Iteration 2, then decreases to approximately 0.001 at Iteration 4, and rises again to approximately 0.024 at Iteration 5.
* **Correct Flip (Solid Black Line with Circle Markers):** This line starts at approximately 0.026 at Iteration 1, remains relatively stable at approximately 0.026 between Iterations 1 and 3, then drops to approximately 0.001 at Iteration 4, and ends at approximately 0.006 at Iteration 5.
* **Incorrect Flip (Dashed Black Line with Square Markers):** This line begins at approximately 0.018 at Iteration 1, increases to approximately 0.021 at Iteration 2, decreases to approximately 0.016 at Iteration 3, and then drops to approximately 0.001 at Iteration 4, and ends at approximately 0.008 at Iteration 5.
### Key Observations
* The "Generation" method exhibits the most significant decrease in the proportion of flips across iterations.
* The "Multiple-Choice" method shows an initial increase followed by a decrease and then a final increase.
* Both "Correct Flip" and "Incorrect Flip" methods show a general decreasing trend, but with some fluctuations.
* The "Generation" and "Multiple-Choice" methods start with higher proportions of flips compared to the "Correct Flip" and "Incorrect Flip" methods.
* The proportion of flips for all methods is very low, generally below 0.03.
### Interpretation
The data suggests that the "Generation" method becomes more stable or consistent with increasing iterations, as indicated by the decreasing proportion of flips. The initial higher proportion of flips might represent initial instability or exploration of the solution space. The "Multiple-Choice" method's behavior is more complex, potentially indicating a more nuanced interaction between iterations and the choice-based process. The "Correct Flip" and "Incorrect Flip" methods, representing the outcomes of flips, show a general trend towards fewer flips, which could be due to the model converging towards a more optimal solution. The very low proportions of flips overall suggest that the model is relatively stable and doesn't require frequent adjustments. The Qwen2.5-14B model appears to be improving its performance with each iteration, as evidenced by the decreasing proportion of flips in the "Generation" method. The fluctuations in the "Multiple-Choice" method might indicate a more complex learning process or sensitivity to the specific choices presented.